SP500 Rallies Back up to Neckline of Head and Shoulders Pattern Lower Volume

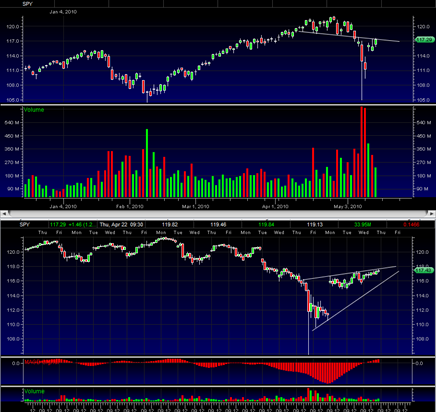
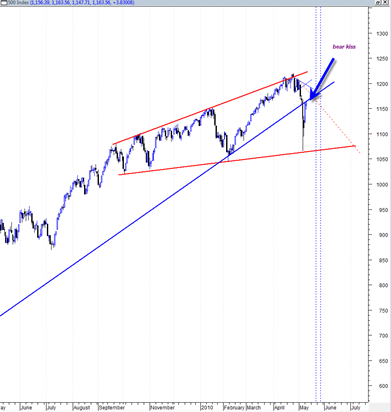
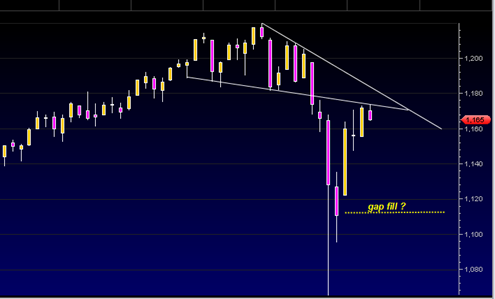
The SP500 today rallied all the way back up to the down sloping neckline of the small head and shoulders topping pattern that formed at the end of April 2010.

Rallies back up to the neckline of confirmed head and shoulders topping patterns is extremely common.  I should also note that this rally back up to the neckline was on significantly weaker volume than the volume that occurred on the downside breakthrough of the neckline.

The intraday chart shows that the SPY is trading in the form of a rising wedge on lower volume.  This should mean that we will break down again from here and perhaps attempt to fill the large opening gap that marked the Euro Bailout.

If the SP500 somehow manages to bust higher again tomorrow or Friday as well and get above and stay above 1182 then something is completely wrong with the bear scenario.

Read more

Went Long the TZA Direxion Daily Small Cp Bear 3X Shs Again Today

BestOnlineTrades went long the TZA again today after having closed out the previous position at 7.00 last week. I don’t normally like to scale into a position or add over time but the way the rest of the market is structured, it seems like an ideal risk reward setup right now. We have already snapped … Read more

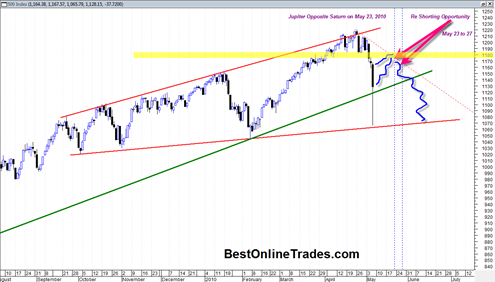
Three Scenarios for the Market Going into May 23rd to May 27th 2010

The bounce in the stock market arrived right on schedule today.  It was big and dramatic however the volume did start to dry up today and I suspect it will continue to do so during the next 5 to 10 days as we move from a high volatility state to more moderate volatility state.

I still believe we are setting up for a historic crash that may be so severe it will really cause an unbelievable amount of shock (and fear) to the system and could potentially on its own be a catalyst for a return to economic weakness and skyrocketing unemployment.

We appear to be entering the most devastating leg of the bear market that began in the year 2000 and from my understanding of Elliott wave this leg down should be relentless and persistent perhaps containing multiple crashes within and almost behaving like a ‘bull market in reverse’.

It is the opinion of BestOnlineTrades that the market should now be traded as if we are going into a new bull market in REVERSE.

There is a larger overall market structure which has been pointed out by the folks at Elliott wave and a few others but I think I will have to devote an entire post to it because its implications are very profound.  The technical argument is basically that the entire market is building a very large head and shoulders topping pattern since the year 2000 top.  But what is most significant about the pattern is where its measurement rule would eventually send the market.  How about zero?  Can you believe it?  Well its true, the measurement implication of this large head and shoulders pattern, if true would send the market indices to zero or single digits at best.  More on that in a future post…

Read more

Direxion Daily Small Cp Bear 3X Shs Overdue for a Pull Back

I think we have seen the lows of the first leg of this panic for now.  The volatility in the market was unprecedented this week and admittedly the close today was not the nicest looking close one could have wished for.

However the market has come down in almost vertical fashion and I expect it to transition now into some type of bearish rising wedge pattern or perhaps something similar into the time frame of May 23rd to May 27th.  At least for now that time frame is the potential trigger for when to go short again or go long the TZA.  But of course I am going to have to re examine the situation as the days roll on.

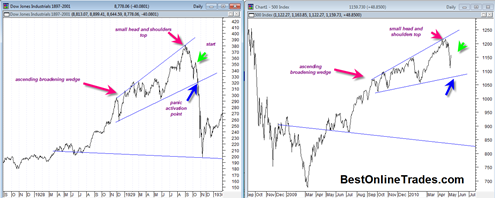
The market will likely be very volatile and confusing in the final part of the ascending broadening wedge formation and identifying the turning point for the next down leg will not be easy but we will give it our best shot.

I cannot rule out the possibility that the nature of the upcoming bounce will be very weak.  But we will just have to wait and see.  The market has already shown us how ‘non supported’ it is on the way down.  Whether that remains to be the case on a reaction rally up is unknown at this time.

Read more

Free Elliottwave Theorist Today a Deadly Bearish Big Picture

Elliottwave.com nailed this market turn once again, just as they called the March 2009 lows.  They are on top the current market movements and use Elliott wave theory as a market roadmap. Headlines are usually about what happened already, but Prechter’s headline is about what happens next. It goes beyond providing information. Yes, he wants … Read more

The Beginning of the 2010 Stock Market Crash

Today was about as wild a day in the stock market as I can ever remember.  I was not watching the market closely in 1987, but I certainly was watching it closely during October 2008. 

I can tell you that the 2008 decline seemed much more orderly than today’s decline.  The 2008 decline was smooth and steady but still persistent.

Today’s decline had much more flavor of panic, rapid price move, total confusion and despair.  The talk on the mainstream networks that today’s decline was because of ‘error trades’ or other nonsense is completely ridiculous.  Today’s decline occurred because the market had moved into an extreme overbought territory at the end of April and had also done so previously up to that point on lighter and lighter volume.

Probably the remaining shorts had covered their last positions near the end of April, so that when the decline started moving into early May, there was a big air pocket under the market, not enough willing buyers and not enough short covering to support the market.

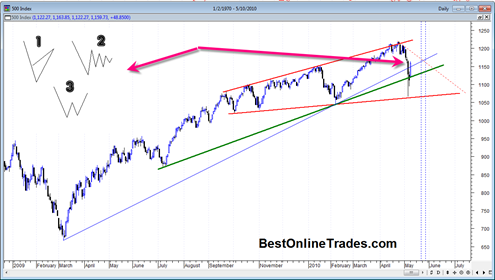
I had a newly developed target today on the SP500 of near the 1127 range because this range would fill an SP500 gap that existed on March 5, 2010.  Not only that but, 1127 is a key area of support in terms of uptrend line that had defined  a portion of this bull run so far.

BestOnlineTrades correctly identified an ascending broadening wedge several days ago and this has proven very useful as a ‘map’ of sorts in determining how price action would play out.

Read more