I have a bad feeling that the Gold Price will get hit tomorrow

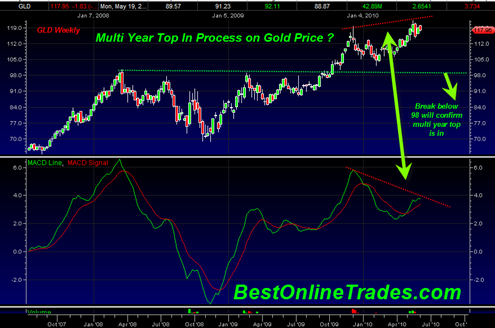
The gold price is in a very touchy situation right now based on the weekly chart and I have a bad feeling right now that gold will get clobbered tomorrow badly on the employment report.  The daily chart of the SPDR Gold Trust (ETF) shows a recent up move retracement on very light volume.

The monthly price swings are also showing me that we have a sell signal based on volume on the GLD.

There is also a very ominous looking weekly price divergence that is developing which could turn into a confirmed sell signal in the weeks ahead.  I think people forget that gold can be extremely volatile to the down side.  It has had an superb run since the 2001 lows, but like any market nothing goes up in a straight line.  Markets need to build sideways cause after huge spikes upward as a foundation point for the next leg up.

If in the weeks ahead the SPDR Gold Trust (ETF) breaks below the 98 level then it is going to put a serious 1st nail in the coffin of gold for perhaps 2 to 3 years and we could see a 50% decline in the gold price from the all time highs.

This is exactly what happened in the mid 1970’s.  Gold went from 200 down to 100   but then after 100 it shot up to 850 for the final blow off run.   So if we break down to 650 then it could very well be the stopping point before another huge run to 5,500 gold price.  So the question is how many in the gold crowd want to sit through a 50% 2 year decline in the gold price ?  A 2 year 50% decline can be a very painful and emotional burden and cause one to doubt the entire premise of the bull market in gold. 

But a 50% decline would setup up massive cause and pivot for a blow off run to 5000 5 years from now.

Read more

Is it time to go Long Natural Gas UNG and Hurricanes

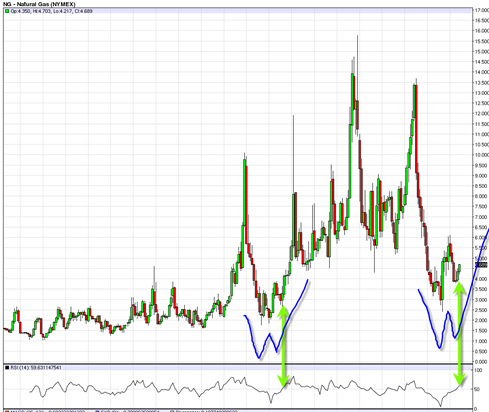
I did a post a while back on the long term Natural Gas Futures chart because I was intrigued by the potential risk reward setup going into second half of 2010.  At the time I was considering the possibility that Natural Gas could continue to break down badly again and do a full retest of the mega bear market lows in the 2.5 to 3 range.

But Natural Gas has managed to hold the 4 level and has in the last two months managed to bounce off of that level with a sign of strength and show some conviction.  It appears to now be creating the right portion of the W bottom I alluded to in previous posts.

My sense now is that both Natural Gas and the United States Natural Gas Fund, LP UNG ETF have bottomed for good in 2010 and that we can expect to see a dramatic rise going into the second half of 2010.

The monthly chart of the the Natural Gas Futures contract shows that the RSI level has broken above and through the midrange 50 level after having touched support.  This was confirmation in previous moves out of these large W patterns and you can see where I reference it in the chart below.

Read more

Here Comes the Bounce

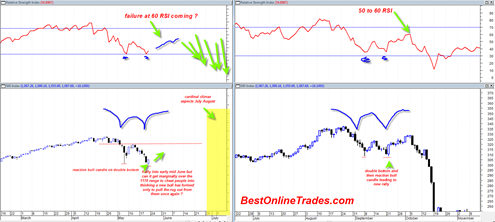
This morning I was looking at the 60 minute 20 day trading chart of the sp500 on Power Etrade Pro.  The last hours bar of yesterday (6/1/2010) was a big red down candle and it looked ominous.  So when trading started today I began to realize that there was not going to be any downside follow through.  Then I also realized that that big down candle was the right shoulder of a head and shoulders bottoming pattern on the 60 minute chart.

So the rest is history and now the market is in full bounce and short covering mode.

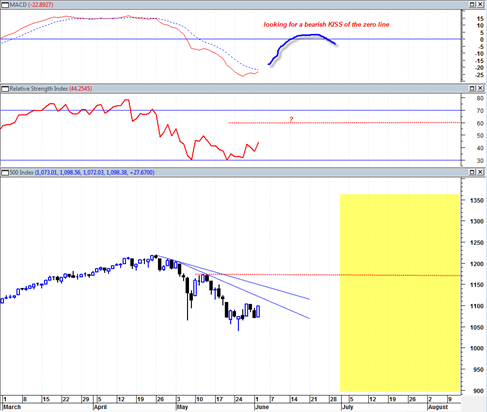
This was my original forecast after I identified the Adam and Eve double bottom.  But the action of 6/1/2010 was a really confusing head fake because that one day’s price action was enough to turn the daily MACD indicator DOWN and had me thinking we were setting up for total collapse without delay similar to the September 2008 period.

But alas, the market rejected that scenario and is now in full bounce mode off of this Adam and Eve double bottom.

I suspect that the employment report this Friday is going to be good enough to send the market higher and then eventually into the 1150 –1170 range.  The key question is how long this will take ?

Read more

SPY does a Bullish Spring of the May 6 2010 Mini Crash Swing Low

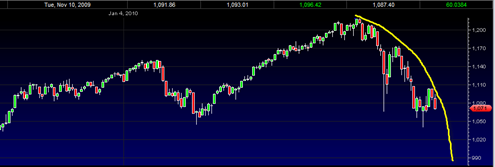
The SPDR S&P 500 ETF today accomplished a bullish spring of the May 6, 2010 mini crash swing low during the last 2 hours of trading today.  A bullish spring is when volume is not sufficiently heavy enough relative to previous swings and closing price is above those previous swings.

It was a close call today because the way the market was set up (including macd histogram, RSI and some other indicators) it really needed to get a good reversal going again otherwise it would have put the market at risk of a very severe plunge below May 6, 2010 support.  It just goes to show how the market is capable of putting everything on the line with only a few hours left to finally give the reversal signal.  The action today had the flavor of capitulation and leaves me much more confident that a true reversal is at hand.  How high the bounce is remains an open question however.

Also helping the bounce case is the US Dollar Index.  It looks like it double topped today on the daily chart and should get some type of move back down to its own 50 day moving average.  Perhaps that will support equities for the next 5 to 10 trading days.

Read more

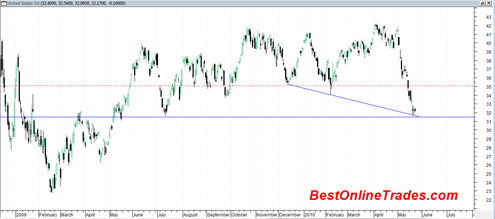
The Crude Oil USO ETF trade did not work out

I was stopped out of the USO United States Oil Fund LP long trade I mentioned yesterday.  I think Murphy’s low applies here, what can go wrong will go wrong especially when it comes to picking spike bottoms. Crude Oil has moved into an even deeper oversold region and it could still be forming an … Read more

I just went long the United States Oil Fund LP ETF USO

Going long the United States Oil Fund LP (ETF) USO or the ProShares Trust ProShares Ultra DJ-UBS Crude Oil UCO ETF may be one of the most attractive trades I have seen in a long time.  It looks like it is an outstanding contrary type trade. I already mentioned that I am expecting a bounce … Read more