IWM iShares Russell 2000 Index at Bottom of Swing Trading Range

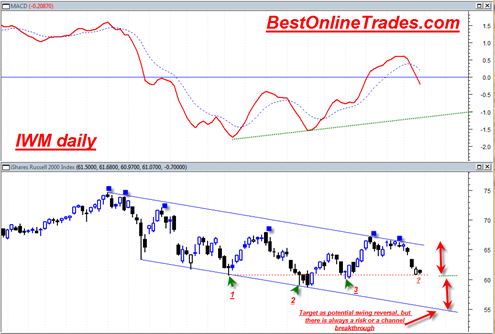
The iShares Russell 2000 Index IWM ETF today had an opening gap down and then a reversal topside for most of the day.   The volume today was typically light which is no surprise this time of year. Today’s action was a pretty typical bottoming type action with the bearish opening gap down and then the … Read more

Another Look at the Russell 2000 and iShares Russell 2000 Index ETF

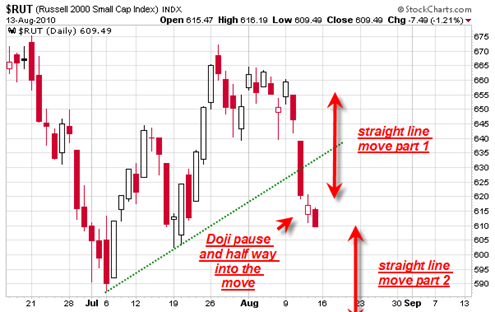
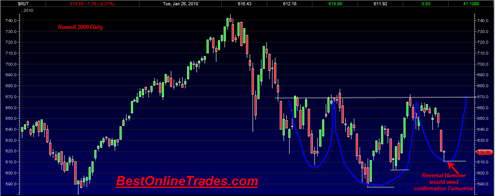
I wrote about the Russell 2000 Index a few days ago and at the time I was writing about it the Russell 2000 looked like it was going to print quite a strong looking reversal hammer by the end of the day.  As it turns out the final candlestick was not a reversal hammer at all.  It was instead just a somewhat smallish looking doji candlestick.

I am not sure if my data provider was feeding bad data or what the exact problem was, because it was showing me that the Russell 2000 candlestick had a long bottoming tail similar to previous key reversal points in this index.

It is a very important difference because the smallish looking doji we printed on this past Thursday 8/12/2010 can now be simply interpreted as a minor pause in the previous down trend and the half way move towards the bottom of an important channel that this index trades in.  See the chart below for clarity.

rusell2k20100815

In addition to the recent doji it can clearly be seen that the candlestick the day before was a sign of weakness that broke the uptrend in force since July 1, 2010.

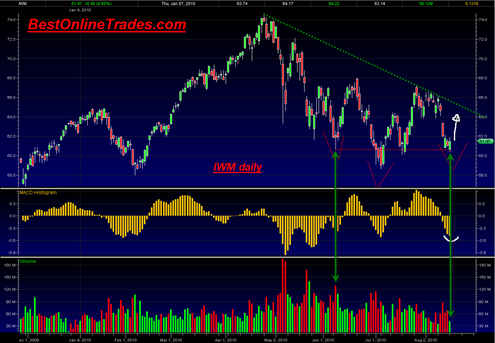
If we look at the chart of the iShares Russell 2000 Index (ETF) (Public, NYSE:IWM) in the slightly larger time frame a more clearly defined picture starts to emerge. 

First lets start with a simple truth about the IWM trading pattern since the April 2010 top.  It can clearly be seen that the IWM has attempted to rally to a higher high during this entire downward trending trading channel but has each time failed (see the blue solid squares).  It has attempted to trade to a higher high 5 separate times but has failed each time.  In the two most recent attempts it failed again and made a small double top, and the second top that created the top also was not able to trade to a higher high.

Read more

iShares Silver Trust ETF SLV Coiling Up in a Symmetrical Triangle

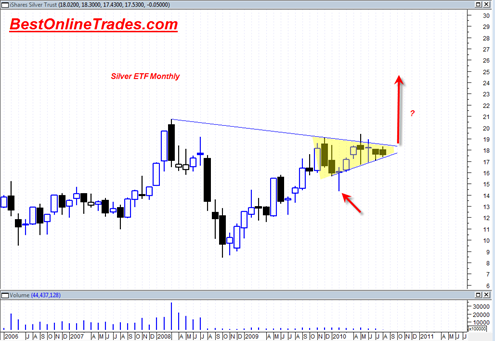
The long term iShares Silver Trust (ETF) monthly price chart of the silver ETF is showing that it is compressing into a 9 month symmetrical triangle that also appears to be the right shoulder of a much larger head and shoulders bottoming pattern. If the iShares Silver Trust (ETF) can get a move going to … Read more

The Gold Market Deserves Full Coverage

In the days and weeks ahead I may start to do more close coverage of both the gold price and the mining stock sector.  I may do this because of the chance that the gold price may soon unleash itself into a raging (bullish) monster and it could start to become more relevant and timely than any other sector in the market right now.

I have been doing a lot of coverage of the sp500 and the SPY ETF.   But I have to tell you honestly, where is the trend in that market ?  It seems like a wasteland of swing trading ranges and lack of real gusto in terms of direction.   The direction will eventually reveal itself but I want to cover the areas that I believe deserve the most attention and ahead of everyone else before they become ‘mainstream’ ideas.

Of course I will still need more confirmation about the possible moves in the gold and mining stock sector in the weeks and months ahead but I am sensing that something big may be close to happening in this sector and I want to be on top of it before the dog and pony show starts on the major business TV networks.

It could very well be that the gold market will become the ‘only game in town’ soon.  People have said that before but to be honest I have still up to this point not really noticed a mass public adoption of the gold story.

Read more

SPDR Gold Trust GLD ETF Close to a MACD Histogram Confirmed Buy Signal

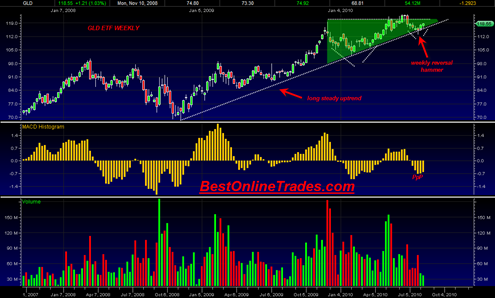
The SPDR Gold Trust (ETF) appears to be close to a weekly confirmed MACD histogram buy signal.  The GLD ETF needs to get a weekly close tomorrow above 118.42.  Currently it is trading at 118.56.

A confirmed weekly buy signal on the MACD histogram tomorrow would in our view be very significant as we are just 2 weeks away from the seasonally very powerful month of September for the gold market.

The weekly chart also shows a weekly reversal hammer of 2 weeks ago in which the trading low of that week tested the neckline of the previous head and shoulders bottoming formation.

The SPDR Gold Trust (ETF) also shows that it was able to crawl back above topside above the longer term up trendline.  This recent move appears to be creating a handle of yet another cup and handle formation which the gold market has been quite famous for time and time again.

gld20100812

One could also argue that the recent 8 to 9 month consolidation resembles that of an ascending triangle formation but is also a cup and handle pattern contained within it.

Read more

Russell 2000 Showing Possible Head and Shoulders Bottom Symmetry

The Russell 2000 today is printing a reversal hammer that looks quite typical and reminiscent of the reversal hammer of 6/8/2010.  In the large swing trading we have been in over the last few months, these reversal hammers have been somewhat famous for picking exact bottoms in the markets large swing trading range. Today’s reversal … Read more