The SLV ETF continues to trade like a champ with 35.78 as near term support. The SLV today pushed to a higher high on record volume, the highest in about 4 months. This to me is a bullish sign despite the fact that it had a somewhat bearish looking reversal by end of day. In the after hours session the SLV managed to remove most of the intra day decline today.
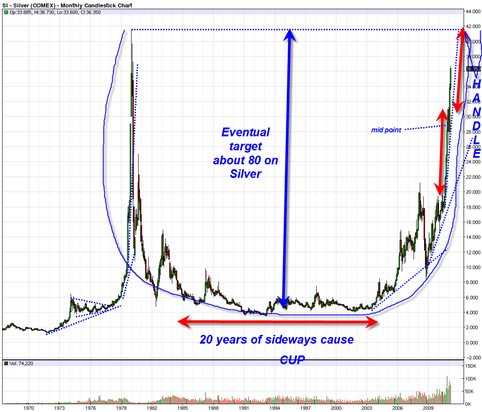
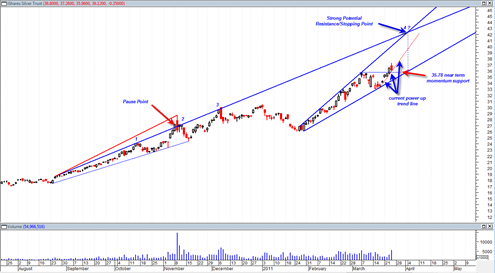
I have drawn in some channel support lines on the SLV chart since the August 2010 time frame and I am able to start to speculate on some early possible targets and resistance points for the SLV ETF. The SLV ETF is roughly about one dollar less than the futures price of silver. I drew in some channel resistance lines that look like broadening wedges on the SLV ETF and it makes the case that the SLV will run into a strong resistance zone near the 41 to 42 range. This is interesting because it also matches close to the silver price peak that I pointed out in the silver futures in 1980.
If you look carefully at the chart below you will see how I come to the conclusion of a 41 to 42 range stopping or pausing point for the SLV. It is a point where the current broadening wedge meets the channel line of the previous run up in the SLV from the 2010 time frame.