Is the SLV ETF Still a Good Long From Here

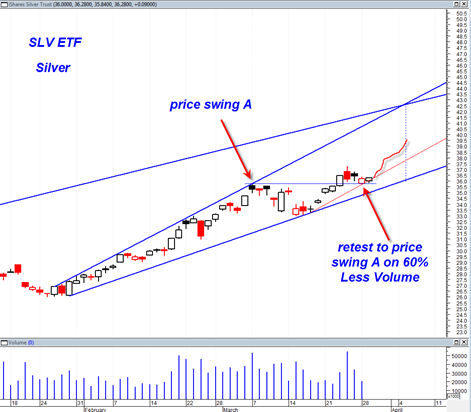
A comment poster wrote me and asked me if I thought the SLV ETF was a good long from the 37 level.  My response would be that one should be keenly aware that the SLV has already made a huge move from early February 2011 up until the present time frame.  Early February 2011 was the ‘easy buy’.

Now the SLV is in a more mature advance stage and I think if one is going to go long from here it should be more a shorter term swing trade long position with a tightly controlled stop.

Why? Because even though momentum still looks quite strong, the chances for more technical selling coming in more heavily are more likely during this stage.  So if one gets too complacent, there is the risk of getting caught in a big profit taking wave.

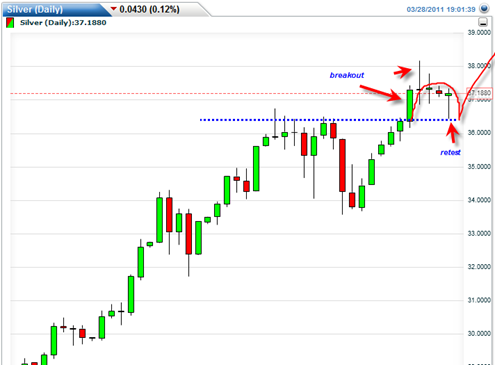
So, I would say that if I were to go long the SLV from here I would try to do it from 37 or slightly under and then set a protective stop loss at 35.70.  That would put the stop loss right under the recent break out area.  Assuming an entry at 37 and then assuming the stop loss gets hit the same day or next day it would equate to a loss of 3.51%.

Read more

Russell 2000 Closes at New 52 Week High Today

The Russell 2000 is falling into its traditional role of early market leader and today closed at a new 52 week high and above the swing high that started the ‘mini earthquake bear’.

I suspect that the other major indices will soon follow suit to the upside.  The Dow Jones Industrial average almost tagged the 2/18/11 swing high today but then sold off a bit near the close.  It is possible that we could see a day or two of downside consolidation since we are at the previous highs on a number of indices.  However, after that I would expect the markets to trend higher again.

The sp500 managed to completely evade the large quarterly shooting star candlestick by trading higher in almost straight up during the last 9 trading days.  This was an astonishing feat because there was real potential for the quarterly candlestick to turn into a very bearish longer term signal.  But instead it now just looks like another typical bullish candlestick that we have become so used to seeing lately on the indices.

The monthly candle in the sp500 now looks like a very long bottoming tail doji hammer reversal candlestick which has the potential to lead to a big up month in April 2011.  The problem with this candle is that it can also be interpreted as bearish hanging man candlestick since it is at the top of a huge price advance.  So it will need confirmation of the bearish setup or a rejection.  A rejection would mean we simply trade higher up into April 2011 which appears likely.

Read more

All Systems Go on the Sp500

The sp500 continues to show near term trend strength and continues to trade within the ‘neutral zone’ I have referred to in previous charts.  Today was an important test of the mini bear trend line and a sound rejection of it if we look at the candlestick structure.  A closing on the highs and a small bottoming tail which reflects the test of the mini bear trend line.

The NYSE summation index is now in a more bullish stance and is close to trend strength which should support the upside over the next several days as we get into the end of the quarter (only 2 days away now).  End of quarter and end of month window dressing appears to be playing an important role this week.

I would not be surprised to see this market attempt a shot at new 52 week highs in a week or two.

The daily MACD is about to cross above the zero line, another bullish sign.  Of course volume was typically light on the advance which has always been a problem with this market.  I have learned the hard way to give price the benefit of the doubt over volume during up trends. 

Read more

No Top in Silver Yet

The silver SLV ETF continues to trade in a very strong manner.  The SLV ETF recently appears to have completed a classic Wyckoff retest on dramatically lower volume of the recent support range.  This is a very bullish sign and is not a time to think about shorting the SLV ETF in my opinion.

The recent retest of support was on 60% LESS volume and shows that the silver bears do not currently have the firing power to push this ETF down in magnitude.  The absolute worst time to short any security is on a dramatically low volume retest of a recent break out area.

I suspect we will see a further short squeeze in the days ahead that should put the SLV near the 40 range.  The silver ETF seems to be leading all markets higher.  It has gold and the stock market on a leash and may pull them higher the next couple of weeks.

Looking at the chart below one can clearly see that we recently did a retest of the important support range on 60% less volume. 

Read more

Silver Futures Do Retest of Key Short Term Support

Silver Futures seem to have managed a successful Wyckoff Retest of the near term and short term support range of 36.43.  Today they printed a hammer reversal and the low of the hammer was the break out level of 36.43.

In the short term I think it is important to hold 36.43, or the low of today’s hammer as validation that this was a successful retest.  Then it could allow the uptrend to resume, perhaps later this week.

In the case of the SLV silver ETF the support range comes in at 35.60.  I should say that there is a small bearish triple P pattern on the daily MACD histogram of the SLV right now.  This is still unconfirmed and would be confirmed on a close below today’s low in the SLV either tomorrow or later this week.

It still seems as though SLV is not finished with this run yet.  I still think there is upside to 40 range at some point and maybe even to 50.  Ideally tomorrow, the SLV will have an ‘up day’ and put the MACD histogram in a new potential bullish stance with possible follow on confirmation either Wednesday or later in the week.  It will be quite interesting given how many top calls there have been lately.  But sometimes top callers are right…

Read more

Several Indices do Small Bearish Engulfing Today

Today several indices did a small bearish engulfing candlestick formation today.  The nasdaq composite and the SPY did, but other indices including the sp500 did not. 

This small bearish engulfing needs to be confirmed tomorrow with a close under today’s low for example on the SPY to show it is a real signal.  It does not look very convincing and we may simply be at a pause in the current mini up trend.

The most potent bearish engulfing formations I have seen in the past are the ones where the bearish engulfing candle easily closes lower than the previous day by a good margin.  This does not appear to be the case today.  It may be a head fake.

So at the end of the day the sp500 is still trading within this described ‘neutral zone’ waiting to make its next move.  It is also still trading above the mini bear down trend resistance line.

sp50020110328

Read more

Can Gold Break Out to a New Life Time High Next Week

I just reviewed the weekly GLD gold price chart versus the MACD histogram and I think I have to come to the conclusion that there is a pretty good chance that next week is the upside weekly break out week for the GLD to new life time highs.

The nice thing about weekly charts is that they tend to smooth out all the noise.  In particular I am focusing on the point at which the weekly MACD histogram transfers from the negative to the positive (from under the zero line to above the zero line).  Every single time since early 2008, this occurrence in the GLD has led to and up week.

Now we see that the weekly MACD histogram is in a similar stance where it looks like it is just inches from transferring from under the zero line to above the zero line.  If the past is any guide, then we should see the GLD finish next week strongly higher in the form of an up weekly closes.  I cannot speak to the magnitude of the move, but it seems one can say with a reasonable degree of confidence that it should be an up move. 

Since the GLD is already so close to trading at new life time highs, I think it can be said that new life time highs should be able to be achieved as well…

Read more

sp500 Could Surprise to the Upside Again Next Week

The sp500 might surprise to the upside again next week and one very big part of the reason may be end of quarter and end of month window dressing.  There are four trading days left in the month next week and four trading days left in the quarter next week.  If the past is any guide, these last four days could have an upward bias to finish the week.

The sp500 on 3/25/2011 managed to bust back above the mini bear down trend line and was also able to trade a full price bar (both high and low) above this down trend line.  It was not a big sign of strength to end the week but it still managed to break above the near term down trend.

Right now I would describe the price action as being in a ‘neutral zone’ (the yellow shaded area below) that  is neither very bullish or very bearish.  It is still constrained within a zone of previous resistance.  The next most important challenge level is 1332.  There is likely to be some selling from that level assuming we can get up there next week.  If we do get to that point then I would look for selling to be contained within the yellow neutral zone to keep the most bullish chances for the market.

Read more

Mining Stock Boom Coming Soon

There has been a lot of ‘chatter’ lately about how the gold price may be at a major top.  I keep looking at the GLD price chart since October of 2010 and have been trying to come to a bearish conclusion but am having a hard time doing so.

It is clear that the GLD has shown a struggling attempt to make new all time highs from the period October 2010 to end of year 2010.  The pattern resembles the somewhat common ‘three drives to a top’ pattern that is occasionally seen in stocks and indices.  But this topping pattern seems to have failed.  During January 2011 we saw the GLD break down, looking like it wanted to confirm the three drives to a top pattern, but then afterwards we saw the GLD take off yet again pushing into life time highs again (into early March 2011) but only for a brief period.

My take is that this most recent push into life time highs again, even though they were only marginal new lifetime highs, should not have occurred if the GLD was in a very bearish pattern.

Instead the GLD now appears to have a cup and handle formation with 152 as the projected target (roughly 1520 gold price).

gld20110325

Read more