sp500 Does a Sound Rejection of under the 1332 Level Today

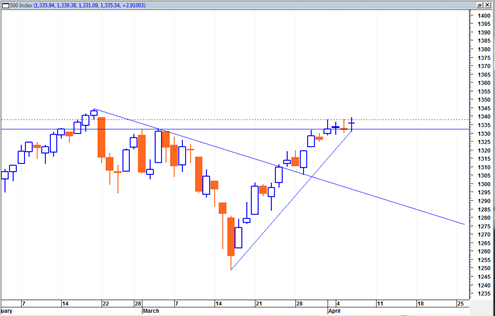
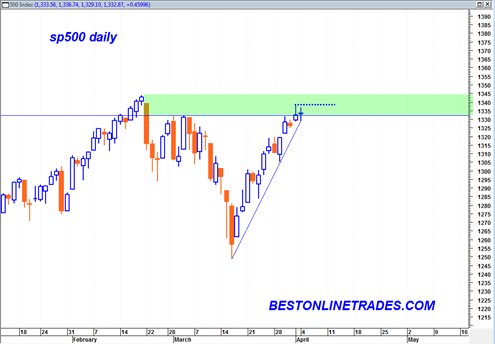
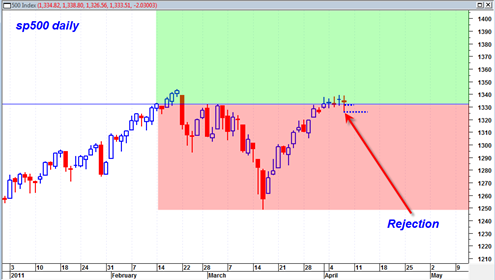
Today my take on the market is that the sp500 did a quite sound rejection of below the 1332 level.  The bears had every opportunity today to seal the deal and get this baby of a market to CLOSE down town below 1332 AND at the same time confirm the recent cluster of doji candlesticks we have seen for the past several days.

Did they get the job done? In a word.. No.

The sp500 dipped its toes into the still icy cold early spring water and decided not to jump in today.  Instead we closed back above the 1332 range and now gives the market at least a chance of trending higher again either tomorrow or early next week.

Having said that, today’s reversal hammer would prove itself even more if the market can get a pop above it tomorrow to finish the week.  That would not only confirm the power of today’s rejection, but it would also give the market a shot at confirming the weekly bullish MACD histogram setup which is still as of today unconfirmed.  Confirmation would come with a close above 1337.85 on the sp500.

Read more

Gold Does Exactly what it needed to do today

The gold price did exactly what the doctor ordered today.  It consolidated in a small hammer doji type candlestick after yesterday’s monster gains.  This is a bullish sign and bodes well for future days weeks ahead. The GLD ETF could easily pull back to 140.72 tomorrow or Friday and the whole chart structure would still … Read more

VG Vonage Holdings Pulls Back to Support Today

I am already underwater on Vonage Holdings by 2.56% today after today’s drop to support.  I would like to see VG hold 4.5 support for an eventual move higher.  Ideally there will be no close under 4.5 in the next several trading days.

In hindsight entry should have been at the lows of today rather than the price action of the last few days.

It is possible that VG is currently doing a similar Wyckoff low volume retest to the one that occurred in the SLV ETF several days ago.  The low volume Wyckoff retest in silver led to the recent huge upside move.  Certainly VG is not worthy of comparison to SLV in a literal sense, but price and volume on the most basic level is essentially the same whether we are talking about tech stocks or obscure commodities.

I do see that VG has an unconfirmed earnings date of May 2, 2011 which may complicate matters a bit.  Still for now I stay long VG and see if it can hold 4.5 support on a closing basis.

vg20110406

Read more

Yearly Sp500 Guide Posts

The yearly candlestick chart of the sp500 is indeed one of the most powerful technical analysis charts in the current multi decade time frame.  The yearly time frame is the maximum time frame in technical analysis and identifies massive bull or bear markets and massive support and resistance levels.

What we can see from the current yearly sp500 candlestick chart is that the sp500 has been trading in a massive trading range since the year 2000.  Before the year 2000 was a raging bull market in equities, a slow and normal trending market.  That was the mega bull future generations will look at in total awe.

But since 2000 the market has been in a highly volatile trading range state.  We see now that the sp500 has been trading the last 3 years (including this year) in an upward recovery trajectory.

For longer term purposes I think it is very prudent to look at the context of the sp500 now within this large trading range.  The fact is that since the March 2009 low of 666 in the sp500 the sp500 has traded higher until today on the order of 100%.  That is a huge move.

The percentage move from the LOW of 2009 to the HIGH of 2009 was about 70%.  The percentage move from the LOW of 2010 to the HIGH of 2010 was about 25%.

Currently the LOW of 2011 is 1249.  A move to 1470 would be about 17.5%.  But a move from the current level of today to 1470 is only about 10%.

Read more

sp500 Resting with 3 Doji Candlesticks

The sp500 during the last 3 trading days has printed three doji candlestick formations.  For now I suspect that these three dojis are just a simple pause in the up trend.  There has so far been now hard down reaction after any one of these dojis.

I have seen several dojis like this cluster before and at least in recent memory a lot of them have simply meant a pause in the trend describing a pattern where prices imply drifts sideways to rest and then finds the uptrend for a new move higher.

The Russell 2000 is already well into new high ground, the DJIA is trying to push to new highs and the sp500 is slightly under the old 52 week high.

I do not see anything immediately bearish about the McClellan summation index at the present time.

I can see the Russell 2000 supported on a pull back to 838 and the DJIA on a pull back to 12260.  The sp500 is still trading above the near term support of 1332 now.  Ideally for the near term continued bullish case it would keep trading above this level either sideways or only slightly down.

sp50020110406

Read more

Gold is a Great Trend Buy Right Now

Today the Gold price finally got the job done.  The GLD was flirting with new all time highs for a whole month and teasing both the bears and the bulls.  With today’s very clear sign of strength, the GLD ETF and the DGP ETF is a very clear trend buy right now for more upside in the months ahead.  This is about as low a risk trend buy as you will see in any market.  Day’s like today are the kinds of days traders wait a long time for.  They provide very little doubt about what the next trend will be and are a huge clue and ‘cheat sheet’ for traders.

Before today, I think still one could have made some bearish arguments for gold, but today’s move decisively puts the daily MACD and the WEEKLY MACD in buy trend mode and I expect plenty of upside from here.

Pretty much the same can be said of the GDX mining ETF.

BestOnlineTrades.com has been talking about how Silver has been leading the markets to new all time highs, then gold was in second place and the Russell 2000 third and the sp500 maybe last.  Silver continues to move higher after the successful very low volume retest about a week ago.  This was a key sign that the silver market was not ready to fall apart despite all the top picking attempts.

I really hate to overplay the ‘Marty Armstrong June 13, 2011’ 8.6 year turning point but once again I find myself thinking about this key date as we see the gold price blast higher today to a new life time high breakout.

Read more

Long VG Vonage Holdings Today at 4.68

I went long VG today at 4.68 as Vonage Holdings seems ready to break above the recent triangular down trend line and trade a full candlestick body above this down trend.  I would like to stay long VG for a week or two or three as a possible swing trade.

There is nothing ‘magical’ about this trade, but it appears to be a small to mid cap stock that is in a growing business with some near term momentum.  So this is a trade, nothing more.  I am not looking for a miracle here, but would certainly like to see some nice upside going forward.

VG has had about a 1.5 month sideways consolidation up until today and is constructive for a new move higher.  The major challenge level is the 4.94 swing high on high volume that occurred on 2/15/2011.  I suspect there will be a bit of selling near that level and maybe even a handle of a cup and handle type situation developing.

I am willing to take ‘pain’ slightly below 4.5 assuming that does occur, but would then like to see a quick resumption of uptrend.

Read more

sp500 Working on a Weekly MACD Histogram Buy Signal

The sp500 today formed a doji candlestick which simply means we are either at a pausing juncture in the short term or a reversal juncture.  This doji today formed after last Friday’s ‘false shooting star’ candlestick.  I call it a false shooting star because the topping tail was not long enough and the close was not bearish at all.

The sp500 has not closed into this green shaded zone that I have referred to several times before.  The green shaded zone is simply a close above the 1332 range which puts the market in an area of much less resistance.  We could easily close back under that zone again depending on what mood the market is in the rest of this week, but for now it appears that today is simply a pause in the uptrend and that we are on our way eventually to new 52 week highs in the sp500.

As pointed out in a previous post, the Russell 2000 is already at this stage, as well at the Dow Transports and maybe a couple other indices.  Certainly it is not a guarantee that the sp500 will do the same, but it does appear now quite likely given the behavior of other leading indices.

Read more

GLD ETF Pulls a Rabbit Out of the Hat

The gold price managed to pull a rabbit out of the hat today and blast higher, which structured the weekly MACD into bullish crossover mode.  As of yesterday there was a risk that the GLD ETF would not be able to achieve a bullish weekly crossover and that instead we would see a ‘bear kiss’ of the weekly trend which would have put the gold price at risk of a possible break down.

Instead this ‘miracle worker’ of a commodity busted higher today and now situates the gold price in a stance for a new life time high type breakout which could be quite dramatic.  I should say though that every time I have expected or anticipated the gold price to somehow shoot up 100 dollars in a day, it has ALWAYS disappointed me and instead trickled up like molasses keeping under the radar of almost every market watcher.

The weekly chart of the GLD is indicating that the breakout should occur during the next two weeks assuming upward momentum holds on the current up trend line.

gld20110331

Read more

Quarterly Chart Review of QQQ and sp500

One of the longest most slowly moving price charts is the quarterly price chart.  It is always a good idea to review this chart after every quarter or two to be sure one is correct on the markets longer term intentions.

The quarterly chart is akin to a large oil tanker.  Once it has started cruising in a given direction it is very unlikely going to change that direction unless acted upon by a very significant force.  The current ‘action’ that appears to be driving the market is the easy monetary policy and this does not seem ready to dramatically change any time soon.

The current factual state of the markets are that we have a bullish quarterly MACD Crossover.  This crossover is in an early state of crossover which basically means that the bullish trend implied by this crossover is just beginning.  In addition the quarterly MACD signal line is just now in the process of crossing above the zero line, another longer term bullish sign.

The last time the quarterly MACD had a bullish crossover was in late 2004.  That led to generally rising prices for almost 3 full years in the sp500.  It could very well be that the most recent quarterly bullish crossover will also lead to rising stock market prices for 1 to 3 years or maybe more.  The current ‘news’ does not seem to support this idea, but relying on news for market direction was never a good idea anyway.

Read more