Sp500 Dips Below Key Support

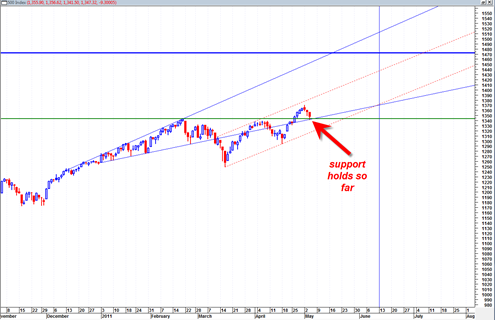
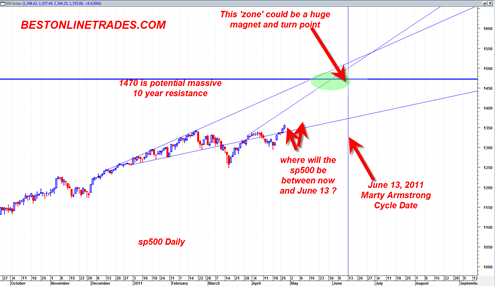
The sp500 today broke down through key support and volume was robust again.  A day like today is not supposed to happen if the market is still bullish.  Indeed today could be an important warning sign that this market wants to transfer into a more complex correction.  The up trend at this point may be on pause.

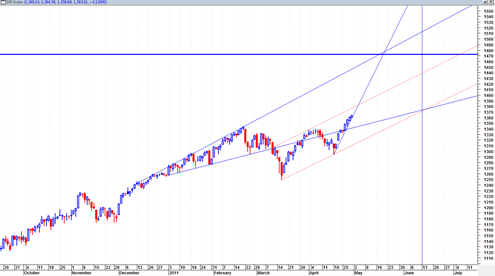
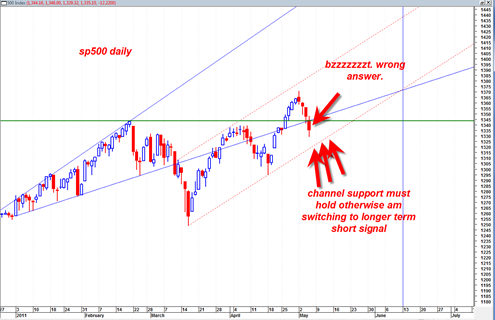
At this point I am still going to refer to the red dotted channel line as the key level that either holds or not for me to switch to outright bearish again.  This is a key channel.

Interestingly, the test of the bottom portion of the channel may coincide with some type of decision on the debt limit increase of the United States.

I do see that the daily MACD is in bearish mode and also the WEEKLY MACD is re confirming a bearish mode and trend.  The bearish weekly MACD is not something to be taken lightly now because if it continues it can eventually start to affect the monthly MACD and really start to roll this market over into a new down trend.

But it is still early and again, I want to see a break of the red dotted channel before I throw my hands up in the air and call this a new mini bear.

Read more

SLV Obeys Top Resistance Channel Line

The SLV looks like it has obeyed the top channel broadening wedge resistance line and has since strongly reacted down off of it on very heavy volume.

This top channel line was known in existence for a long time and was pointed out here many times at BestOnlineTrades.com.  There was a chance that the SLV could trade to an extreme above 47 for a blow off move above the top channel line but now we see that this was not meant to be.

Now the SLV finds itself trading below the bottom broadening wedge boundary line and ideally will find a way to bounce back up into the broadening wedge.

There should be some type of ‘automatic rally’ from either the current price range or a little bit lower from here that could last for several days.  These almost always occur because of the previous strong momentum.  But it can be an art, not a science in pin pointing the exact low before it actually occurs.

Ideally a gap down opening tomorrow would serve as the panic low and mark the low and then the SLV could trade higher from there.

Read more

DBLE Double Eagle Petroleum on Life Support–Cheetah Trading System

DBLE, the second trade of the Cheetah Trading System is on life support right now.  The Cheetah Trading System is currently suffering a very heavy draw down of 16 to 18% because of an entry at 10.5 many weeks ago.

I really find myself in an unusual situation and it may speak to one of the flaws of this experiment.  I mentioned before that trading with an initial small amount of capital probably requires that in the early going not too many top losses or actual full round trip trades are triggered because it can really start to hurt an account with a starting value of $1000.

But this thinking at the same time has caused me to take a much larger draw down than I would ever even normally consider in the past.  Usually in the past I am out very quickly at the slightest hint of under performance.

But with DBLE I have been sitting on my hands and watching it crater perhaps because of my stubbornness to avoid commissions and the desire to get the account moving up in the early going.

Anyway, so here I sit now still in DBLE and today it did a hammer reversal.  The recent decline has been on light volume.

The other problem is that earnings are coming out tomorrow in the AM. So there is a real risk that this drawn down can turn into a disaster tomorrow.  If we break below the low of 8.67 tomorrow then I have to qualify DBLE as being in a new down trend.

Read more

sp500 Doing a Typical Wyckoff Retest

So far at least the sp500 is doing a typical Wyckoff retest of the previous high and on the SPY the volume was robust but not unusually high.  But still it was at 182 million shares today versus the 2/18/2011 high which was on 130 million shares.  This is normally not a good sign for any retest.  The market should not be pushing with higher volume on a retest of a previous high.

Whether or not this leads to a big drop below today’s low this week remains to be seen, but for not it is a potential warning sign.  Until that time, I am viewing today as a simply Wyckoff Retest of the break out area.

The sp500 is still trading within this red dotted channel area and also is holding support above the solid green horizontal line.  That is about as simply as it needs to be at this point.  No need for over analysis paralysis.

The NYSE summation index is starting to curl over slightly and is in a sloppy drifting mode.  It is not exactly speaking with conviction but it is still on a buy signal based on the 5 and 10 day exponential moving averages.

Read more

sp500 Trading on a Steep Trendline

The sp500 continues to push higher on a rather steep up trendline.  However it does appear to be close to the top of a new channel formation.  If the channel is valid then we could start to see some price give back and a more modified up trend. If the channel is incorrect then we … Read more

AFFX Another Possible Big Pattern Trade

A very clever comment poster here at BestOnlineTrades named ‘JR’ has brought to my attention the AFFX price chart and I decided to take a closer look.

The longer term monthly candlestick chart of AFFX looks attractive enough to me for me to call it another ‘big pattern trade’.  It appears BestOnlineTrades now has three choices for the next Big Pattern trade, HGSI, TLR and AFFX.  It is currently unknown to me at this time which is the best big pattern trade of the bunch.

The nice thing about Big Pattern Trades is that generally speaking there is more time and flexibility to go long these types of trades since they usually evolve over the weekly and monthly basis.

Anyway, AFFX appears to have broken out from a large falling monthly wedge pattern.  Monthly RSI looks constructive and seems ready for a bullish move above the 50 percentile line.

The April candlestick breakout in AFFX was not on huge volume or wide price spread.  This could be a short term concern, but the positive is that a full monthly price candlestick is trading above the falling wedge which should allow AFFX to start to trend higher from here.

Read more

Cheetah Trading System Update DBLE

The second trade of the BestOnlineTrades Cheetah Trading System DBLE is failing to move so far and I am currently under water on the trade.  I am still in this second trade of the BOT CTS and currently intend to stay long the trade.

Clearly I was too early on this trade.  In hindsight I can see that it would have been better to enter this trade TODAY, instead of 7 days ago.  Today the trade is doing a slightly higher low double bottom retest on low volume.

I am hopeful that DBLE is at the bottom of the current trading range and will oscillate back topside to the 10.75 range within the next week or two.  I would like to exit the trade on a possible breakout in a few weeks.

As indicated in a previous post, I want to be long TLR and am watching it for signs of ‘the move’.  So for now I sit and wait in DBLE hoping for a profit to be realized within the next few weeks.

dble20110427

I may have to add the rule that as part of the Cheetah Trading System I can only enter trades after double bottom retests, or tests back to trendline support.  This appears to be ‘more safe’ and but better odds on my side.  I want to avoid if possible being stuck in a trading range for 7 days.

Read more

sp500 Continues to Blast Higher

The sp500 continues its typical bullish tendencies since BestOnlineTrades decided to re instate the BOT Long signal on 4/18 and 4/19, 2011.  The sp500 is in a bullish trend and I expect it to continue to act this way for the duration of May and perhaps part of June 2011.

The NYSE summation index is crossing bullish again and should help to keep the wind at the back of the sp500 for a while going forward.

The market is essentially on auto pilot now and there is an outside chance that it may start to trade in a rather steep northward parabolic fashion.  This is just some early speculation on my part.  I don’t know for sure if the market will trade in typical two steps forward and one step back or if it will trade in 10 steps forward and 1 step back.  But I am speculating that it may move higher at a faster rate now.

Unknown is if the sp500 can reach 1470 by June 13, 2011.  It is somewhat of a longshot based on how the index trades, but if we move into parabolic then maybe it could be possible.  The solution? Simply wait and see how the market shapes up into this time frame.

For now my theory of topping action by June 13, 2011 is just that, a theory.  But this theory holds for either the sp500 or the gold and silver market.  The vertical nature of the gold and silver market tells me they may align with the date and turn hard on that date for a unique shorting opportunity.  It may be a massive short opportunity in the metals near that date… we shall see.

Read more