Important Long Term Ultra Bearish Scenario for sp500

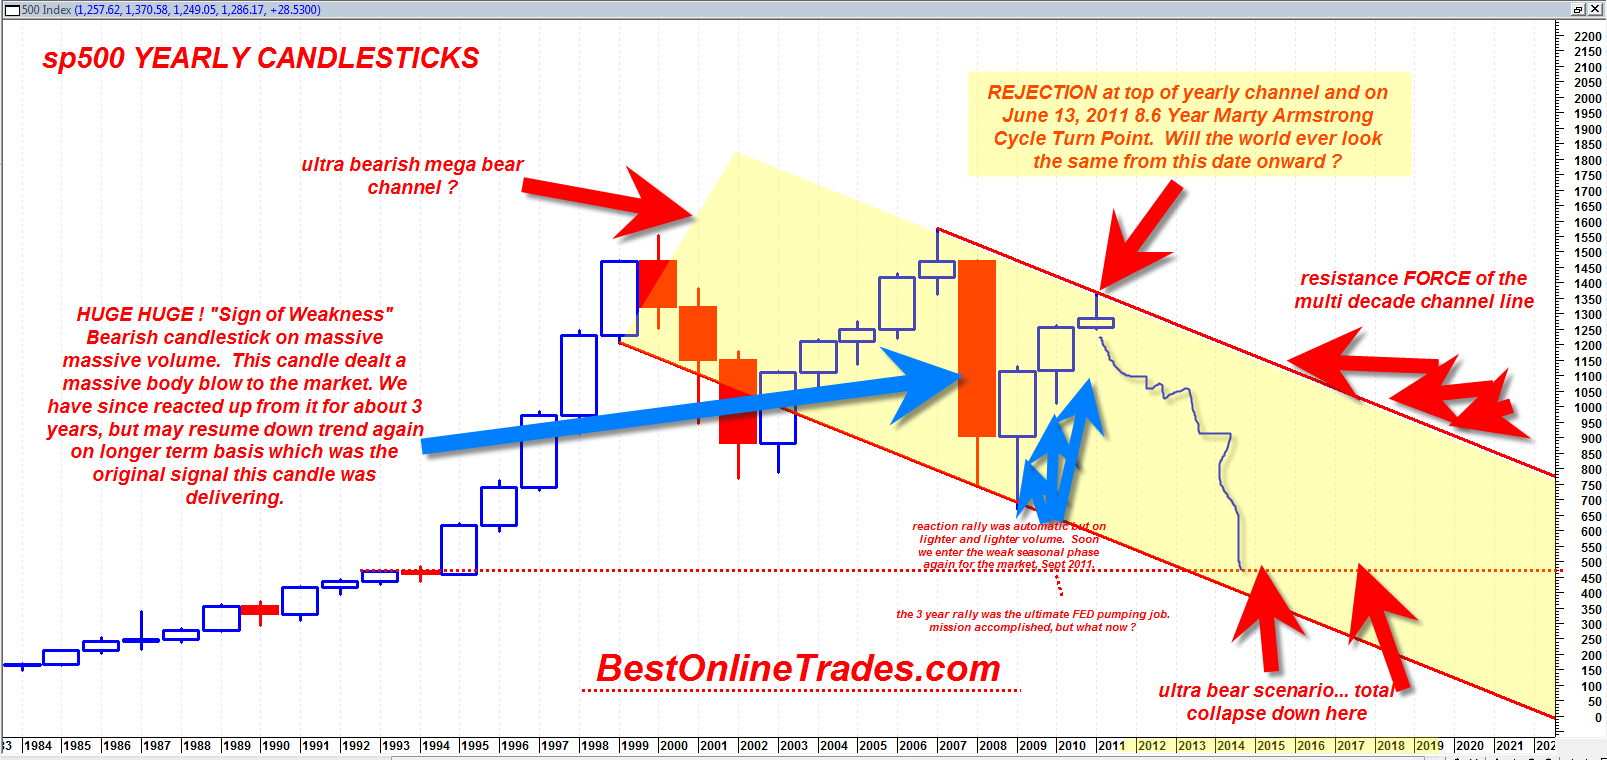
The chart you are about to see below may be one of the most important sp500 charts I have ever created with possible dramatic implications for the next 5 to 10 years.  This long term chart is much different than the other longer term multi year charts because this one shows a down trending channel.  My previous multi year chart shows a massive horizontal channel which is still valid.  But the horizontal multi year channel implies a simple trading range instead of a mega bear channel.

The very long term chart of the sp500 on the yearly basis shows that there exists the possibility that we are not hitting the top portion of a mega yearly channel right on the Marty Armstrong Cycle turn date and that this turn could mark the beginning of a multi year down move back to the bottom of the channel.

If true then it would put the sp500 eventually near 450 by 2016?  That is an extremely rough guess.

Read more

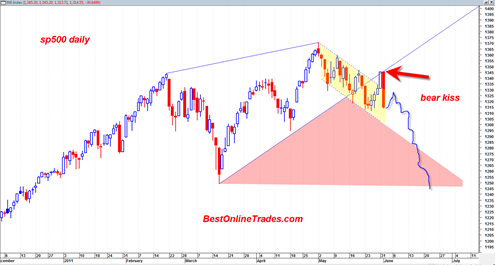
BOT Short Signal at 1310

I am putting the BOT short signal back on again on the sp500 at 1310.  The bounce is not arriving and I would rather put the signal on now.  Whether we bounce 10 or 20 sp points from here seems to be a mute point for now. Yesterday was a HUGE sign of weakness and … Read more

8.6 Year Marty Armstrong Cycle Turning Point Starting to Unleash its Power

Today’s action in the sp500 has me thinking the 8.6 year cycle model turning point I have been talking about ad nauseam for months now is starting to take effect and turn this beast of a market into a sideways to down market.

Today we saw the sp500 blast back under the tight channel I have been referring to and did so on robust volume on the SPY ETF.  This was very bearish action today.  The breakout from the channel yesterday was false.  The market re asserted itself to a bearish trend today.  This should keep the weekly bearish trend going again and continue to manifest the possible weak or weakening monthly trend.

I think it quite possible that we are at a very important top in the market here.  It is no coincidence that this turn action is occurring only a week or two from the June 13, 2011 cycle model turning point.

In yesterday’s post I pointed out a very large possible structure on the Dow Jones Transportation Average that could take the shape of a massive head and shoulders bottoming formation.  If true then we could see some hefty declines in this index to create the right shoulder of the pattern.

Even if we are at a major top here in the sp500 I expect it to be choppy.  Tops take long to form and are messy at the top.  Just look at the 2007 top and how long it took to fall apart.

Read more

RPRX Repros Therapeutics Speculative Biotech with a Nice Long Term Chart

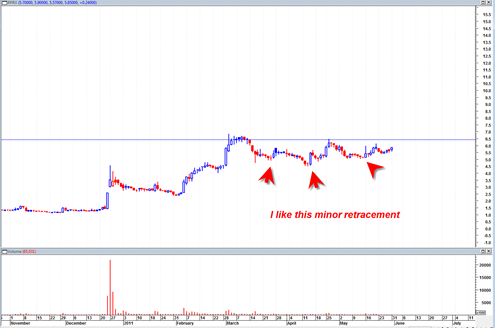
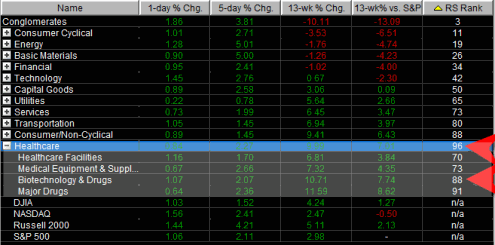
I like the potential setup of RPRX right now and going into the second half of this year.  In case you have not noticed yet, biotech and healthcare sector is on fire right now and currently has the strongest relative strength of all trading sectors (see first chart below).  Relative strength of sectors is important because it shows where current strongest momentum is and strongest money flow.

This is good for timely moves in hot stocks within that sector.

Previously I remember the oil sector was almost literally on fire.  But now it is near the bottom of the barrel in terms of relative strength and the healthcare and biotech sector are the new lead sled dogs.

rs

So with that in mind, RPRX Repros Therapeutics is a highly speculative biotech stock that has under 8 million shares in the trading float.  This means that this stock can really really move if enough volume comes into the stock.  A 10 million share day for RPRX would be the equivalent of trying to fit a basketball into a garden hose.

Read more

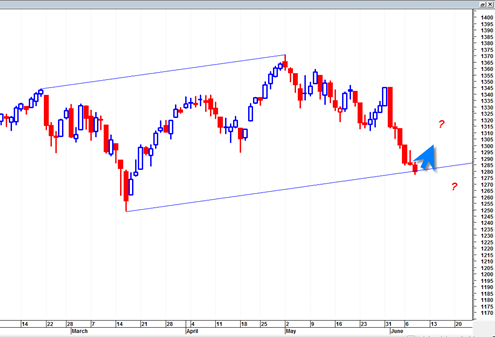
sp500 Breaks out North from Short Term Trading Channel BOT Neutral for Now

The sp500 today broke out north from the tightly compressed downward sloping trading channel we have been working through the past several weeks.  The market appears to want to move higher again to a new 52 week high eventually.

At this point this is a clear long signal again, but I am holding off switching to BOT long signal and instead take a wait and see attitude on whether the market can make a new 52 week high.  We are only about 8 days away from the June 13, 2011 cycle turning point of Marty Armstrong and I would rather wait and see if any type of turn occurs on or near this date.  This is partly why I am just switching to neutral for now.

You know the old saying ‘a wolf in sheep’s clothing’.  Well in this case the wolf is the long side and the sheep’s clothing is the neutral side.  Basically I believe the long signal is correct going forward again, but I would rather bide my time and stay with neutral until I see true northward confirmation.

Put simply, I want to see full sp500 price bars above 1370 before switching back to long signal.  That should be more than enough time to see what, if any, effect the 8.6 year cycle point has on the market.

Read more

UTX United Technologies at Uptrendline Juncture

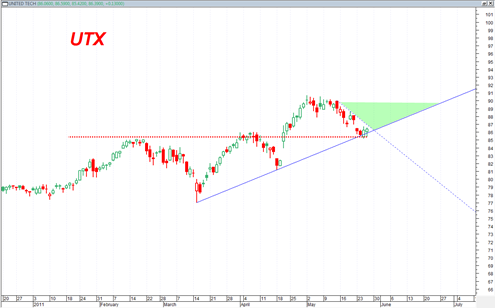
United Technologies Inc. UTX, is at an important juncture and is a great example of a stock moving back down to meet an uptrend line.  It is at this moment that UTX must make a decision to either continue the uptrend it was previously in, or bust below trend and violate the previous up trend.

UTX is a DJIA stock and so usually moves with the index.

UTX breaking into the green shaded area is going to be a promising sign for the stock although I doubt that would occur on a low volume end of week day like tomorrow (Friday 5/27/2011).

Note also from the chart below that UTX is on a supportive area combined with the return back to up trend line support.  So it would seem there is some potential here for UTX to maintain the current up trend.

The three most recent candlesticks show that yesterday UTX did a bullish engulfing of the day previous to yesterday.  Today we simply see a small reversal hammer.  So they look somewhat constructive for a mini base to move higher again.

Read more

REGN Regeneron Pharmaceuticals Great Example of a Return to Trendline Buy

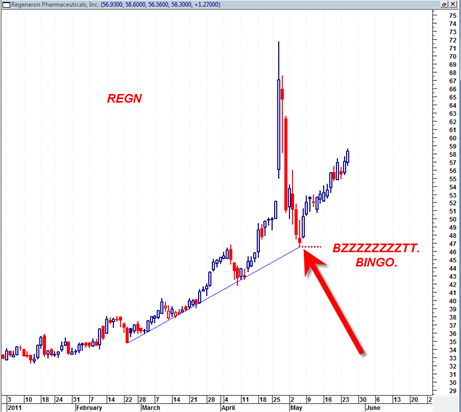
I talked about REGN a while back after it had made a HUGE high volume spike up.  It ended up doing a mini crash from that level.  But it did something more interesting than that.  It did a somewhat swift return to trendline support which now in hindsight was clearly an outstanding buy.

REGN is a great example of a ‘return to trendline’ buy signal.  Only the most patient would have been able to take advantage of the buy back to up trendline support.  But also those who specifically target this type setup probably did as well.

In fact I think this simple trading strategy could be one of the most effective strategies out there today.  Think about it.  It is very simple and functional and very definable in terms of stop loss.

However not every stock trades in a such a clear linear up trend like this.  So the key is to try to identify stocks that have clear precise and somewhat steep uptrends and then be patient enough to wait for the return to trend line buy.

Read more