QQQ is Showing a Bullish Spring Based on Volume and Price

I do not know why I did not notice this before.  Perhaps it is because I have not been following the markets as closely as usual.  I have been a bit pre occupied with other business lately and have not gone into as much depth on various market indices as I normally do. 

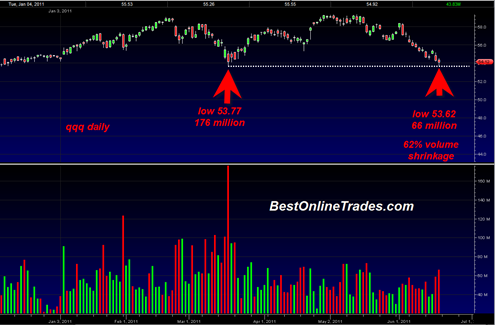
But I just pulled up a chart of the QQQ and it has me now thinking that this market has bottomed out based on volume.  Yes, just 2 postings ago I wrote a post on how the market now looks like a 50 50 proposition in either direction.  But after looking at the QQQ, it makes me think the market is already saying it has rejected the lows today based on volume and price.

Look at the chart below to see what I am talking about.  This is basically what market analysis boils down to, volume and price.

We today tested a very important previous March 13, 2011 high volume swing on 63% less volume and then closed back up inside the range.  That is a bullish spring based on volume and says the bottom is in.

Read more

5 Week RSI on Sp500 Seems to Be Saying we Bounce From Here

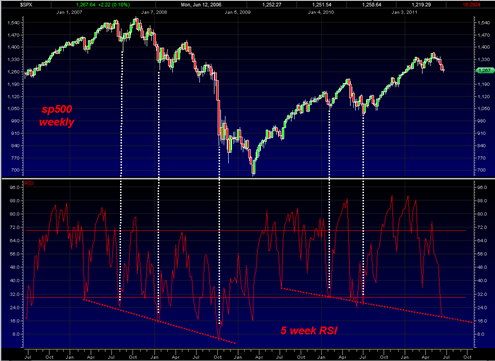
Someone emailed me a chart of the sp500 against the 5 week RSI indicating that it looked very oversold.  I decided to investigate and looked over the chart myself.  I find myself coming to the same conclusion.

I do not think I have ever focused on the 5 week RSI for timing but it seems to be making a case for a bounce from here on the weekly basis.

Of course 5 week RSI can always get more oversold into ‘extremely oversold’ range.  It is a matter of probabilities.  But the current 5 week RSI reading is showing that the market is the same oversold condition as was the case only 3 other times going back to early 2008.

If we are going to get more oversold on the 5 week RSI from here then it would start to challenge the oversold level that occurred during October of 2008 which was an extreme record and major outlier.

Read more

BOT Long on sp500 at 1294

Might as well switch to the BOT long signal on the sp500 now even thought I am very late on the bounce from the large swing trading range. There is a daily bullish triple P on the macd histogram although still unconfirmed.  Honestly I should wait for confirmation so I am being aggressive switching to … Read more

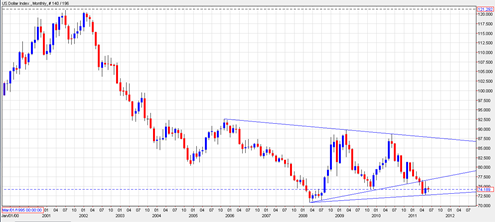
Death Spiral for the Dollar Below 71

A death spiral would occur for the US Dollar index below the 71 range in my opinion.  Currently the dollar appears to still have broken down out of a very large symmetrical triangle formation.  It is debatable exactly which line marks the lower boundary of the triangle formation, but the current monthly chart of the … Read more