Elliottwaver Makes Similar 2007 2011 Comparison

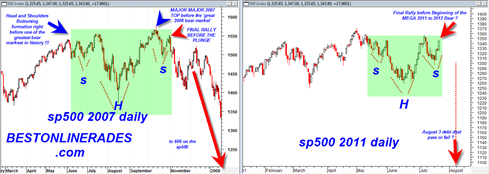
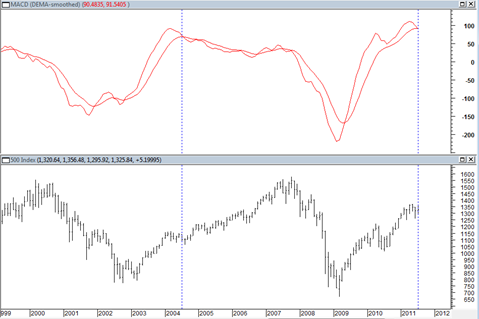
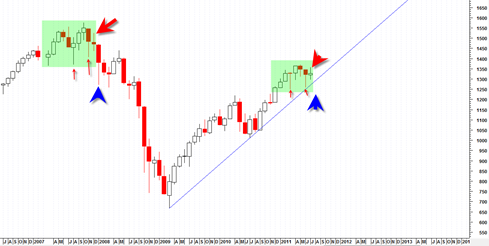
This Elliottwave site makes a comparison between the 2007 and 2011 time frame to argue possibly that we are at a similar juncture for a break down as was the case in 2007.

Recently I have also done a 2007 2011 comparison with respect to the head and shoulders bottoming formations that were occurring near market highs.  The comparison is compelling and the elliottwave argument is also compelling.

Having said that I have to admit that the recent talk by politicians and TV network pundits on how the stock market will crash this Monday if there is no debt deal is quite concerning from a contrarian standpoint.  Suddenly the politicians and the TV talking heads are expert stock traders and can predict a market collapse this Monday?

Something does not click here.  From a contrarian standpoint I have to say that all this ‘market will dive’ talk unless there is a huge deal by end of this weekend is concerning.

Read more

RPRX Poised for Possible Upside Breakout

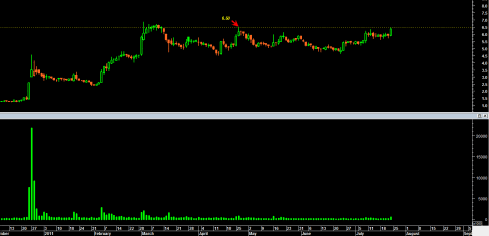
RPRX, a highly speculative biotech stock that I have mentioned on a previous occasion appears to be at an important juncture.  The juncture is the 6.50 price level which it needs to fully exceed (preferably with a full price bar above the level) to consider it a breakout.

It would also be good to see the 6.50 price level exceeded with 700,000 or more shares in volume.

A breakout is not a breakout until it actually is.  Strange as that may sound, it is true.  I have seen many a ‘potential’ breakout, only to see prices reverse by end of day and fail back under and into the previous range the stock was trading in.

If RPRX is not able to exceed the 6.50 level this upcoming week with conviction then one may have to assume it will remain range bound and head back to the bottom of the recent longer term trading range.

For now I do not believe that will happen.  My charts are saying that RPRX has a good shot at an upside breakout this week.

Read more

BestOnlineTrades Trivia Part 2

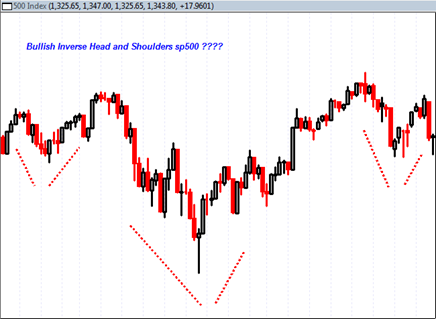
In my previous posting I put forward a mini trivia question on a portion of price action in the sp500 that shows what appears to be a bullish inverse head and shoulders pattern.  But is it really bullish?

I have pointed out in some past posts that inverse head and shoulder patterns that form near the very top of a market advance are probably less favorable than inverse h&s patterns that form after an extended market decline.  I do not have statistics to back that up, but it seems like a natural conclusion simply from a risk reward standpoint where price is trading in the phases of a trading cycle.

So the answer to the trivia question is JUNE TO OCTOBER 2007.  What is important about June to to October 2007 ???  This period was the final top of the period 2007 and right after the inverse head and shoulders pattern completed the market went onto dive into one of the greatest most devastating bear markets in market history.

Curiously we now have another inverse head and shoulders bottom in the sp500 in the 2011 time frame with a debt deal as an apparent deadline for market deciding type action.  It would seem we are at almost the same juncture in terms of pattern similarity.

Read more

BestOnlineTrades Trivia

Sometimes things are not as they appear to be.  Here is a short piece of BestOnlineTrades Trivia for you.  Within the next 30 minutes I will post a follow on post explaining why this trivia question is potentially important. The trivia question is:  The chart below represents sp500 price action that takes the form of … Read more

The Market may get Crushed by End of Week

The action today in the market so far is quite curious.  I mentioned yesterday that the big rally we had yesterday was probably a ghost rally.  Today’s action seems to be confirming that theory.  Why?  Well with all the bullish AAPL news we see AAPL only up 3% and the QQQ DOWN half a percent.  … Read more

Back to BOT Short at 1302

Ok back to BOT Short at 1302.  The sp500 cannot hold 1313 and the tape is once again weak.  The bears have the tape for now.  I have to revert back to a previous post that referenced the monthly trend which does indeed look quite bearish. This small head and shoulders bottom was a non … Read more

Back to BOT Long at the Open

It looks like yesterday’s dip under 1313 was a fluke and today we pop back above it again.  So back to BOT long again as long as we hold above 1313.  If we do not or fail by the end of the day today then will go back to BOT short.  Sorry for the confusion. … Read more