IDOI IDO Security Pinksheet Stock at a Tipping Point

IDOI, the pinksheet sub penny stock that I have mentioned a couple other times could be at an interesting ‘tipping point’ going into today. I mentioned in an earlier post that I preferred it to make some kind of move this week otherwise I would not talk about it again.  Well we are almost as … Read more

There is a Blockbuster Trade Developing in the Gold Market

gold20090722

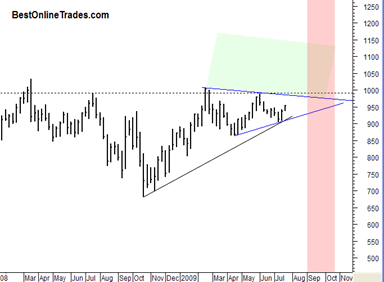
There is in my opinion a blockbuster trade developing in the gold market right now.  It is one of those slow motion type developments that usually catches people off guard.

This has the potential to be a very big trade in my opinion.

The chart to the left is a simple representation of what I am talking about. I will go into more detail on this in future posts.  You can click on the chart to the left to see it full size. The trade developing is a combination of a symmetrical triangle pattern in the gold price in addition to very bullish seasonals coming in September 2009.  The red shaded area represents the very bullish seasonal time frame for the gold price.  The green shaded area represents break out territory of the gold price from this several month congestion area also represented as a somewhat large symmetrical triangle pattern.

Read more

Fifth Third Bancorp FITB and Chemtura CEMJQ on the Watchlist

fitbcemjq

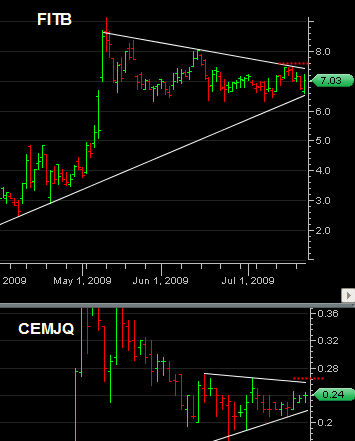
I am initiating FITB and CEMJQ on the BestOnlineTrades recommended list with buy stops.  That means that they are not fully recommended yet but are positioning themselves possibly for some good upward movement.

FITB is a mid cap bank that has a fairly clean chart and has been price trending upwards for quite some time now.  It has that run away rally during early May but since that time (about 2 months) it has consolidated in a slow downward slanting wedge of sorts.

Now it finds itself kissing the up trendline as of today and so far holding ground.

So I am initiating a buy stop at 7.60 for FITB on the premise that once it is able to get above down trend resistance we could start to see a new up trend.

CEMJQ or Chemtura is the Chemicals company with large international exposure that could see benefits from a collapsing dollar price.  That one has also had a nice run along and uptrend line and done a more violent pullback back to up trendline support.  I am initiating a buy stop on CEMJQ at .2750

Read more

Time to RADAR UNG possible BUSTED Pattern Setup

This is an important heads up.

I mentioned the UNG Natural Gas ETF before as having a possible busted pattern setup (See the related posts section at the bottom of this article).  A busted pattern setup is when you see a stock or index have a breakout out of a pattern (for example a symmetrical triangle) in the intended normal direction of the pattern.  But then instead of a continued follow through, the price reverses back inside the pattern for a complete reversal.

By doing so the stock or index is giving the exact opposite signal. UNG is up 4% right now off the bottom.

ung20090722

Based on the chart above a move back inside the range of the triangle slightly north of the 15 area could activate the busted pattern bullish signal here.  There is absolutely no question that natural gas futures and the UNG have been in an extremely bearish trend since July of 2008.  So here we are at the bear market lows.  These types of setups off of major bear market lows can be some of the best setups out there because the first moves off of a bear market are usually the most rewarding.

Read more

SP500 Confirms swing test with Adequate Volume

This is a follow on update to my previous post during mid day where I was talking about an important volume swing test that the SP500 was doing today.

The comparison is between the 6/11/2009 price swing on the SP500 which had an intraday high of 956.23 on volume of 1,222,768,700 (NYSE Volume).  Today we tested that June 11th swing high on the SP500.  Today’s high was 956.53 and today’s volume was 1,207,021,284 (NYSE Volume).  The close on the SP500 today was 954.21 so we ended up closing below the 6/11/2009 swing high.

It was a successful volume swing test because the volume today was only about 1.3% less than the 6/11 swing high, so we are within 3% which is enough of a signal and indication to me that the market can continue higher from here.

Note that we did close under the 6/11 swing high.  So the volume test was successful but price did not manage to close above the swing high.  So it says that we could base around here at these levels for a bit or even do a pull back to the previously mentioned heavy volume gap on the SP500.  But even if we pull back from here at the top of this trading range, the market is still saying based on volume that it will ultimately break these swing highs.

The Nasdaq, or the QQQQ as a proxy for the Nasdaq is leading the way to the upside and has already broken the horizontal swing point levels.  So that is a hint in my opinion of what is to come for the SP500.  Clearly the Nasdaq is the strongest index out there right now.

It is pretty amazing to me that this possible upside breakout is developing right as we sit here before August, traditionally one of the lowest trading volume months.  But regardless of the seasonality, we must respect what the price and volume is telling us.

Read more

Chemtura CEMJQ is worth watching for a new up trend

cemjq20090721

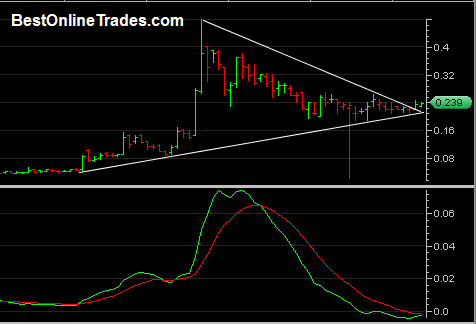
CEMJQ the specialty chemicals company is worth watching right here as I am seeing positive MACD trend as well as sustained support along its uptrend line and also slightly peeking out above its downtrend from a bit more than one month ago.

I believe that Chemtura gets close to 50% of their business overseas.  Don’t quote me on that but I believe they have a substantial portion of their business overseas. So why is this important? Well I just wrote about how weak the US dollar index looks.  If the US dollar starts plummeting, then it could have significant currency exchange benefits to CEMJQ and other multi national corporations.

Read more

US Dollar Index Barely Holding Crucial Support

usd20090721

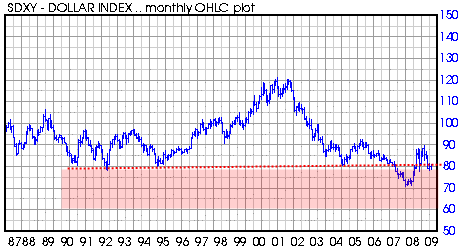
The US dollar index is barely holding onto crucial support at the 79 level.  This is a MAJOR story in my opinion and could have dramatic implications for several markets including forex, the broad market and gold.

The clear story with the US dollar in 2008 has been the MEGA bounce that it was able to achieve with the flight to safety trade and liquidation trade that was occurring all through 2008.  The US dollar was the ‘least worst’ currency in light of all the worldwide macro problems occurring then.  But now, with calmer heads prevailing and the US administration printing money and starting new programs like they will never go out of style, we see the US dollar once again weakening.  It has now fallen to the 79 range of support.

The 79 range of support is not a simple support, it is a very significant support that goes all the way back to 1990, clearly a significant length of time for a support level.

Read more