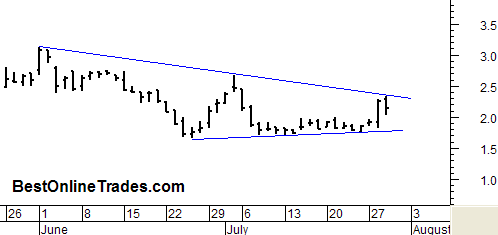
PACR Pacer International Setting up for a Breakout

PACR

BestOnlineTrades recently developed a powerful new computer scan that scans over four thousand five hundred different stocks (Nasdaq and New York Stock Exchange).  It is a superb scan because out of that entire list of 4500 plus stocks it only returned 1/3 of 1% as viable candidates! (.27%)  And it typically seems to only return a maximum of 20 stocks each day.  That is extremely valuable not only because of time savings, but also because of the quality of the candidates it seems to find.  It is a custom scan I developed that uses a combination of two very powerful indicators.  One of them happens to be an indicator that the famous Jake Bernstein likes to use a lot.  But when used in combination with our own custom indicator, the quality factor goes up 5 fold.

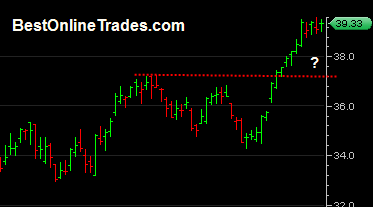
PACR Pacer International is one of the stocks that came up in the scan and we are glad that it did, because it looks quite good to these eyes.  The few months to the left of this chart are also significant (not shown on the chart above) because in March PACR did a nose dive into the 1.7 range area, then it rebounded to the 5 level only to fall back where we currently are in this congestion area.

So one could say that the current retracement is a complex double bottom and now we have built sideways cause here for about a month and are perched just under the resistance line close to the mid 2’s.

Read more

Quick Update on Sarissa Resources

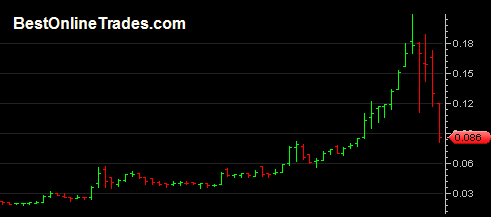
I just wanted to do a quick update on Sarissa Resources (SRSR).  Yesterday I said that I believed that the .081 low yesterday would probably be the final low.  Well today we took out that low slightly and closed at .083 .

I still think that we are going to get a violent upside reaction rally in SRSR pretty soon.  It may be good for 30 to 50% profits.  The real rule though is that we just do not want to see SRSR trade below today’s low.  As long as it does not do that, and maybe gets an inside bar, then I think the upside reaction could start.

You might say it is like trying to catch a falling knife.  Well not exactly.  Sometimes you can catch a falling knife if you are very very careful in how you go about it. 

I have seen this trading pattern many times already, and they have looked quite similar to the pattern in SRSR right now.  The fact that SRSR is a pinksheet stock does not really change the scenario or the final outcome.

One of the most famous upside automatic rally reactions I can remember was in a company called Taser Corp.  They are still public (symbol TASR) now but the stock has been languishing for years now.  But previously when they had enormous momentum the price hit a superbly exciting peak, but then literally crashed down similar to the way SRSR has now crashed.  But then sure enough an automatic rally ensued that took the stock into a violent trading range for months.

Read more

What I learned looking at 415 ETF Charts Yesterday

Yesterday I downloaded from an online database the entire full list of all ETFS and then converted their symbols so that they could be displayed in my charting program.  I am not too sure why I did not do this before because I can tell you with zero doubt that ETS are really a superb trading and investing vehicle.

You’ve got leverage, liquidity, choice, flexibility, low fees.  I mean what more could you ask for ? Why even bother with stocks or futures or anything else for that matter when you have ETFS?  It is something to think about for sure.  Me personally I like to have as many options as possible, because you never really know where a good trading setup might come from.  Yes there could be a great ETF trading setup, but there could also be a great setup in a penny stock, a blue chip, a Canadian stock, many places!

But I can tell you after scanning through 415 ETF charts one by one in my charting program something occurred to me.  A lot of their patterns look the same and…

95% of them follow what the SP500 does!

It’s true.  Most of them bottomed in March 2009 and most of them have been moving up since then.  Some stronger than others, but their primary direction has been in line with the SP500.  Perhaps this is an obvious point since many ETFS contain sector component stocks which also trade on the SP500.  And some of them just follow specific sectors.  Even commodity ETFS followed the SP500 as well.

Read more

QQQQ Does a Full Intra Day Reversal Today

qqqq20090730

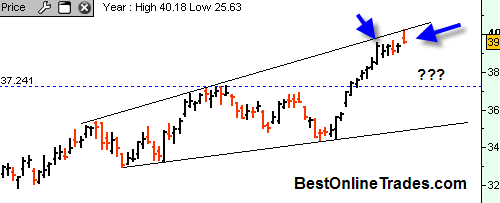
Remember I did this post on the SP500?  I was talking about how we are somewhat constrained by this top line resistance that has some tendency to a broadening wedge formation.  Then I did a post a couple days ago on the QQQQ and said that the QQQQ’s seem to be signaling a top based on a test of previous swing with 26% lighter volume.

But Today the Market was up like the 4th of July!

Yes it was.  I thought for sure I would have egg all over my face after saying that the QQQQ’s had signaled a short term top based on the price retest on 26% less volume and a price close under that relevant price swing.

Read more

Gold Futures create a Double Inside Quarter

goldfutures20090729

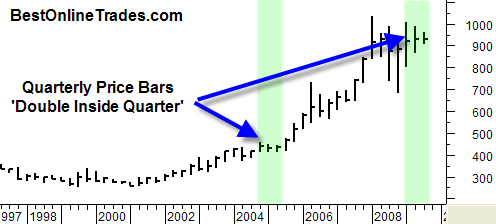
The chart you are looking at here is the quarterly price bar chart for the continuous gold contract.  I love long term charts like quarterlies because they forecast bull market moves and are definitely geared towards longer term forecasts.  This gold futures chart is no exception.

Something very significant has developed in the gold price on the quarterly chart.  For the first time since 2004 (that was a long time ago!) we see a double inside quarter developing.  A double inside quarter exists when the two most recent price bars each have lower highs and higher lows than the preceding price bar.  It is similar to a ‘coiled spring’ in that you have price compression.  These ‘double inside’ patterns do not really forecast price direction either up or down, so we could see a big move up and out of this pattern, or down and out of the pattern.

Read more

US Dollar Index Bounces off of Support Creating Bullish Divergence

usdollar20090729

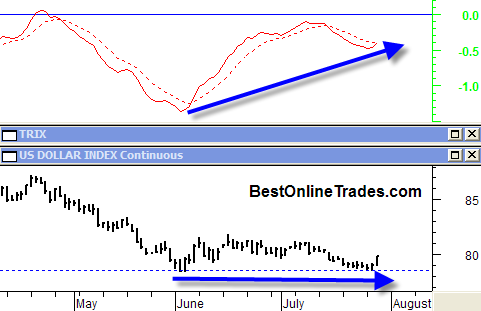
The US Dollar Index has elected to bounce off of support creating a short term double bottom.  The bounce has also created a bullish divergence which is now playing out and should allow the US Dollar to move higher shorter term.

In a previous post I was talking about how the US Dollar index was at crucial long term support and that it really needed to hold the 79 level.  A significant bearish decline could ensue with a downward break of the 79 level.  But so far the index had decided to evade this break of support and is now heading higher as a result of this moderate shorter term bullish divergence.

Read more

PLM Polymet Mining Corp Ready for an Uptrend ?

plm20090729

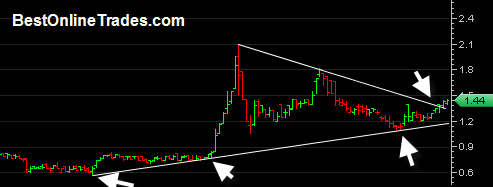
Polymet Mining Corp may be getting ready for some sort of uptrend here pretty soon.  If you look at the chart I can conclude a few things already.

  • It has held support on its uptrend line since mid March with 2 tests.
  • It has completed a consolidation of about 2 months duration.
  • It has broken through the resistance as defined by the white downtrend line.

So I think we might see a trickle of an uptrend on this one.  But I have to add that these mining stocks are not for the faint of heart.  In my experience they tend to trade with heavy retracements and cumbersome up trends.  And it makes sense that they trade that way because they are in the mining industry which in generally requires large equipment and investment costs and slow to market type products, especially when they are in the exploration stage.

Apparently Polymet wants to mine copper, nickel and other precious metals precipitate according to their website.  You know, I really wish all mining companies right on their homepage would say in very large text exactly what they are mining for, what their proven and probably reserves are, and when they plan to start production (or if they are producing right now how much).  That way it give the entire investment community an quick 1-2-3 idea of what they are dealing with.  Perhaps I am a bit lazy to dig through all their information myself but it just makes sense to me to provide that right up front especially for mining companies since it is one of the most important factors in their valuation.

Read more

QQQQ has a Non Event Day

qqqq20090729 Yesterday I was talking about how I noticed a confirmation sell signal on the QQQQ’s based on price and volume.  But today we really don’t seem to have confirmation either way. Volume was slightly higher on the Q’s but as far as price goes we did not test either the high or low of yesterday so we really don’t have much new information to go on.  Today is considered an ‘inside day’ since we stayed within the low and high of yesterday.  Tomorrow, if we again stay within the low and high of today, then that will be a ‘double inside day’ and would be a sign that a big move is coming.  Confused yet?
But seriously, double inside days can lead to big price moves.  They problem is they do not give a directional indication, just a general signal that a big move may be coming.  But since we don’t have a double inside day yet there is nothing to go on.

The market in general seems very reluctant to give any price back despite my signal for short term bearishness.  Perhaps it is not surprise since we are really getting close to super low volume summer doldrums season coming up here in August.  I suspect that if we do get a pullback in the next week or two, that it may be really quite a lame one.

Read more

Bounce Play in SRSR Sarissa Resources coming ?

srsr20090729

There may be a ‘bounce play’ developing in SRSR Sarissa Resources, the pinksheet stock that has a tremendous run over the last few months.  It peaked out near .20 cents last week and the last few days price has been literally free falling like there is no tomorrow.

This is a highly speculative type setup (or is it?), however I believe SRSR could be setting up for what is known as an ‘automatic rally’ either by end of day today or tomorrow.  An automatic rally from current levels could lead to a 50% move higher.

An automatic rally is  just like a rubber band or a bungee cord.  You can stretch a rubber band only so far until the opposite forces take over and then it SNAPS back in the other direction almost automatically.

The heavy volume today seems indicative of us being close to washout levels.  I would not be surprised to see us hit .14 or .15 cents on a rebounding automatic rally.

The only question is, is today the bottom or tomorrow.  I am going to stick my neck out and say that .081 is the final low and that we will not have another washout day tomorrow.  I suppose we could break .081 tomorrow and then reverse back up on an intra day reversal… but that is guesswork.  I will just stick with the low being .081 and believe the automatic rally should start either by late end of day today or tomorrow.

Read more