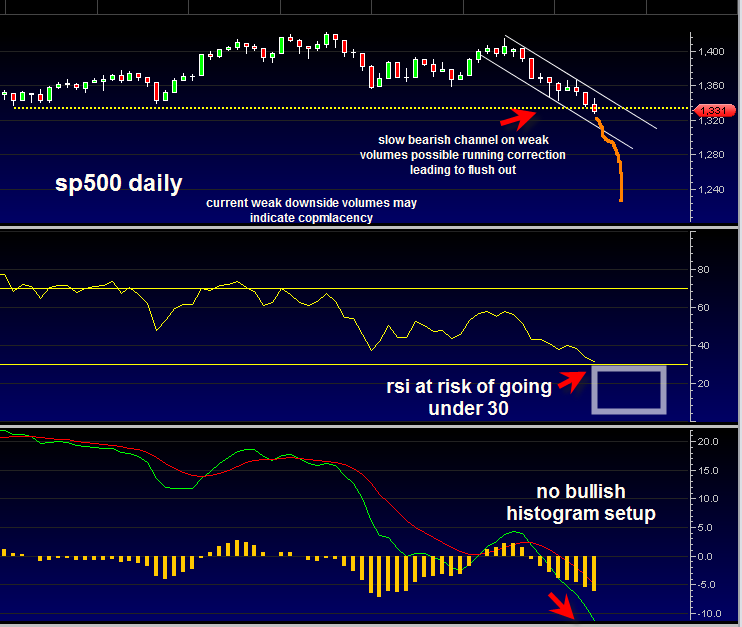
The slow grind down.
This is what is occurring in the market right now as represented by the sp500.
A few of my recent postings have been done during market hours and describe a bit of the confusion and frustration with the market to ‘get it done’. When I say ‘get it done’ I am referring to the bears getting the job done right and getting the market to flush downward in true bearish fashion.
The bottom line as of today’s posting is that the market is slow to getting a real flush out. The tape action is slow and frustrating ( to me at least). In addition bearish tendencies are not showing true form in terms of volume (as represented by the SPY, DIA and IWM ETFS). The downside volume has been weak and frustrating at best and is showing risk of a big upside bounce based on weak volume retests in SPY DIA and IWM.
Still, the fact remains when we review the weekly, monthly and quarterly charts of the indices, there is evidence that we are in the 1st inning of an extended down trend. The longer term charts seem to have the upper hand with regard to bearish tendencies at this juncture. Still, we have to be careful for taking anything for granted, even with the longer term charts.
Other important observations from today.
- The relative strength index is near the 30 oversold range. A break under 30 would traditionally be the clue that the market wants to flush out. But the 30 range is also an ideal spot for a strong upside reaction rally so one has to be careful in automatically presuming a bearish flush out will occur. The weak volume seems to be warning a big upside bounce will occur.
- Two ETFS that are well worth observing carefully are the UUP ETF and the TLT ETF. The UUP (US dollar index ETF) showed a dramatic up move on nice volume and continues to confirm that the UUP is on the verge of a major uptrend or at least upward stability instead of decline. The TLT (20 year treasury bond fund ETF) also continues to show strength and appears to be on the verge of a massive cup and handle breakout that spans all the way back to 2008. If this cup and handle is valid, then the bullish measurement of the pattern seems to suggest a surge in flight to safety is coming in a big way.
- Commodities continue to get clobbered and are leading the way down.
Pausing briefly with the technical talk, my general sense going forward is that Europe is about to go down the ‘rabbit hole’ and take the rest of the world with it. This process is likely to take place over the next 1.5 years. So again we are talking a ‘long term process’. During this time it is likely in my opinion that there will be a longer term flight to the US dollar from Europe and elsewhere versus the Euro. This will lead to the US Dollar Index getting a big upward surge which in turn should put pressure on USA equities for quite some time.
The monthly chart of the sp500 is starting to show a 2B sell signal as we are breaking under the 1360 support zone. However the month of May is not completed yet. It is looking like the easier downside tape if it is going to occur will occur in June 2012. June or July 2012 would present a better opportunity for a confirmed MACD monthly histogram confirmed sell signal.
Above is the daily chart of sp500 showing once again that there is no clear sign of reversal. There is no bullish MACD histogram setup and RSI continues to drift towards 30 level. The low downside volumes could either mean complacency or that we are due for a sizable upside bounce. However any bounce I would say needs to start occurring very very soon (ie. 5/16/2012) given how close we are to important support.

