The sp500 today showed bearish action to me. Today was a HUGE opportunity to bounce this market and close on the HIGHS, OR bounce this market, then sell off near the close, but then FINISH at the highs or near the top of the range.
Was it accomplished? No.
The tape looks quite weak to me. Having said that, I have to admit that we find ourselves near the bottom of the recent swing trading range and the typical behavior near previous swing trading ranges is the desire to continue the range (ie. more bouncing action between resistance and support).
My sense is growing more and more that we are setting up for a spectacular stock market crash. I think the market can be very deceiving as it tries to disguise its true intentions with a day such as we have seen today. Green price action, the sense that things are somewhat normal and calm. But we have already seen the personality of this market after the recent rally attempt into 8/17/2011. It peaked on a pseudo tri star doji pattern and then plummeted about 5% almost out of nowhere. This is the nature of this bear and I suspect we will see more of these sneaky surprises.
My take is that a lot of the markets REAL action is going to center around this Jackson Hole Meeting and BB is scheduled to speak this Friday.
If the market rallies very hard from here up into Friday (I don’t see this as likely for now), then I think whatever Ben B says on Friday will strongly disappoint the market and cause it to turn down into overdrive.
If the market sells off from here down into Friday, then I think Friday could be a big turning point to the upside. This is my early speculation.
The volatility index continues to behave similar to the way it did in 2008 and seems to be building more structure for another series of blasts higher which would mean some big down for the market coming up.
It could also very well be that we simply tread water for the next 4 trading days and then make the decisive move this Friday which spills over into the week after.
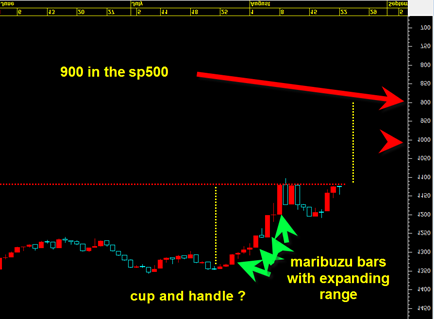
Looking at the sp500 Upside Down
If we look at the chart of the sp500 upside down it starts to get very interesting from a bearish perspective. The upside down version chart of the sp500 looks like a cup and handle pattern which is quite a bullish pattern.
It also has a measurement rule which can be forecasted. The measurement rule of this cup and handle projects to about 900 on the sp500. A more conservative measurement comes in at about 1000 in the sp500.
So the bottom line is that the inverse chart of the sp500 looks very bullish to me which would mean that we should assume the exact opposite, that we are in for some very bearish action during the next two weeks.
Notable also is the way the last two days price candlesticks are hugging right under resistance without taking out the previous price swings. It could suggest the market is simply building up a bit of energy to bust out when it is finally ready.

