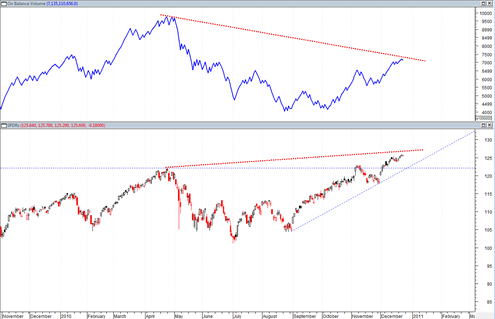
The on balance volume indicator still is not able to confirm the current mega rally in the SPY ETF to new 52 week highs. While the SPY ETF moves to new 52 week highs, the on balance volume indicator struggles to exceed the April 2010 highs.
I have shown this indicator one or two times before and I do not rely on it very much and do not believe it gives any clear signals from looking at historical prices.
There was a period after the 1998 Asian currency crisis when the market pushed onward to new 52 week highs and yet the on balance volume indicator could never make it to new follow on 52 week highs.
So while the on balance volume indicator does not seem to be good at picking tops, it may be somewhat useful in projecting a phases where the markets upward strength starts to become more limited and the trading action more choppy or sideways which could then later on lead to a more involved bear market phase.
It took the market almost 2 years after the 1998 currency crisis to finally top out despite the fact that on balance volume never confirmed the rally from 1998 to mid 2000 year.
So I do not recommend using the on balance volume indicator for precise market timing purposes.


Tom
thank you for update and comments on OBV on SPY. you have probably seen WSJ 27th December – – C1 – – “Investors Look on Bright Side Now” an article on bullish sentiment, to rather extreme levels. the article perhaps an ill-omen for bears, but there are lots of hints that market is currently frothy and IF it keeps going up, it will be positively irrational
you are welcome. yes sentiment is out of control now I agree. I have to revert back to my previous theory that we might trickle higher right into end of year and then get some kind of fear moving into the market as we get into 2011. Problem is, another scenario is that we just keep trickling up during January and then correct as last as February.