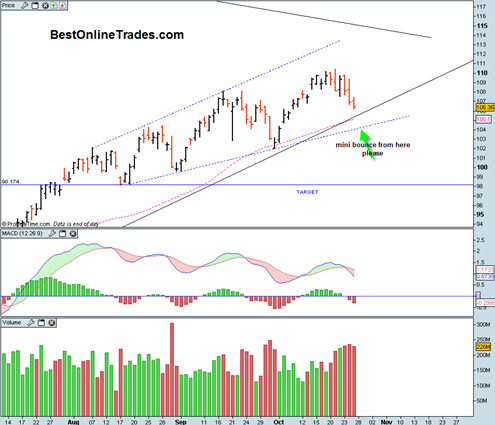
The S&P 500 as represented by the SPY ETF continues to look real bearish to me and I continue to see confirmations all over the place that we have hit ‘the top’ on October 18th, 2009 and are now in long term correction mode.
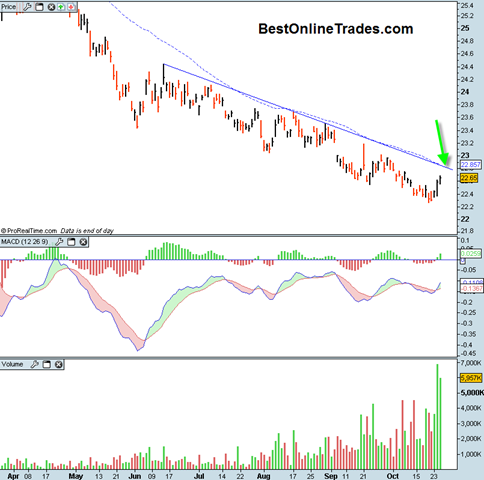
The UUP US Dollar ETF had close to record volume again today and a nice up close as US Dollar short covering kicks in and the MACD bullish divergence works magic.
The TZA 3X triple bear ETF also advanced today on near record volume again today.
The downside volume in the SPY ETF was pretty heavy relative to advancing volume trends and continues to drive home the point that sellers are stronger than buyers and benefit of the doubt should go to the short side in the month(s) ahead.
The great trader Tim Ord identified a broadening wedge pattern in the SPY ETF which is a tricky pattern but definitely a bearish one according to the CLASSIC book Technical Analysis of Stock Trends by Edwards and Magee. Edwards and Magee say that it is bearish “9 times out of 10” and that, “they appear most often at or near an important topping out of the trend”. They have a few chart examples in the book and a few individual stock chart examples. Apparently many of these broadening topping patterns were being formed
By the way, the book I just mentioned, Technical Analysis of Stock Trends is one of the most important Technical Analysis books I have and I highly recommend any trading newbie or pro keep it in your trading library. It is a true classic and extremely well written. I was lucky enough to get my copy in the basement of a library that labeled it “Discarded Library Material” what a big mistake they made there!
Anyway, we have 3 trading days left in October to finish creating the monthly price bar and I have been going back and forth how this is going to play out. I wish I knew exactly but I can only go by subtle hints.
Today’s action in the SPY ETF suggests to me that we could get another down day tomorrow. If we had gapped down today and had some sort of mid range or reversal close then I might be inclined to think more bullish for tomorrow. But the action is telling me we go down again tomorrow.
I think a decline tomorrow could once again be related to the recently strong US Dollar Index (UUP ETF). If we manage to get another bounce in the UUP to both its 50 day moving average and down trendline resistance level then that could equate to the SPY moving down to either the March uptrendline support line (the solid rising black line) OR the dotted blue line at the bottom of the broadening top formation.
I would MOST prefer to see the SPY ETF BREAK through the black long term uptrendline support level creating damage to it and then see us hit some kind of intra day low near the dotted blue line representing the broadening top formation.
THEN, I on Thursday I would like to see the market bounce UP off of that dotted blue line on some possibly positive GDP report news and then bump its head UNDER the long term black uptrend line (solid black line).
That is what I would like to see! I would like to close out shorts at the dotted blue line and then re enter on some sort of bounce off of this dotted blue line. That is my game plan for now but I am drawing a very specific forecast that is unlikely to play out exactly as I am planning it. But I will cross my fingers and hope for the best.
An alternative scenario is that we head UP tomorrow after an intra day low that touches the black up trendline and then on some possibly bad GDP data on Thursday head down very hard Thursday and Friday. Gee, the possibilities seem endless! But no matter what the specific possibilities are, my bias is still bearish. The question is when the bounce materializes.
Looking at the chart of the UUP ETF (US Dollar Index) above you can see that the downtrendline is almost at the same point as the 50 day moving average. I would expect the UUP ETF to bump its head right on the down trendline and then get at least one day DOWN after that as a normal reaction of hitting resistance. But then after that a massive move that shoots the UUP well above the 50 day moving average. That massive move is the one that ought to help the SPY ETF SLAM down into the broadening top target of the 98 area or so as seen in the first chart above.
This is one heck of a specific ‘script’ I have drawn up here and I tell you I will be AMAZED if it plays out EXACTLY as I am forecasting here! As I said, I would like to close out my short positions on intra day tests of the key levels above and then re short aggressively after a 1 to 3 day upside bounce!
Lets see what happens going into the closing monthly price bar of October (this Friday) !


