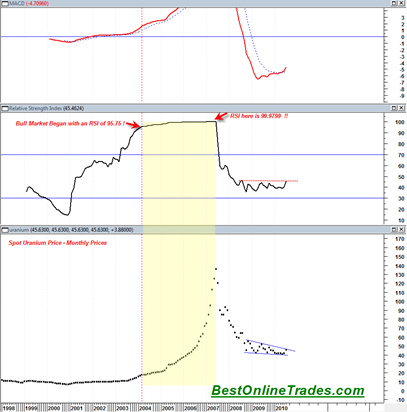
I just finished plotting the monthly spot uranium price back to 1/1/1998 and I have to tell you the chart of the spot uranium price is probably one of the most fascinating charts I have ever seen in my life. It is more fascinating to me than the 1970s chart of the gold price because it looks like its is a much more persistent mania than that market was.
The monthly chart of the spot uranium price is definitely long term and slow moving. The implications are for months and years into the future, not days and weeks.
Perhaps the most interesting aspect of the monthly spot uranium price chart below is that the first stage of the mega bull market began with the 14 day RSI at a level of 95.75. This is not entirely true. The very beginning of the bull market began in the year 2000 at an extremely oversold RSI level of 14.7, but the majority of the move started from the RSI 95.75 level.
I do not believe I have ever seen such a persistent move in any stock, index of commodity as I can clearly see in this chart of the uranium monthly spot price. I have seen penny stocks and regular individual stocks trade persistently higher before, but never before have I seen the RSI pinned to such high levels for such a long time and then even reach a maximum value of 99.976.
Part of it has to do with how uranium spot prices are determined. There is a futures market for uranium but my understanding is that it is very illiquid.
So I suppose the main point of this post is that uranium appears to be in a raging bull market. The first major leg of that bull market kicked off in the year 2000 and peaked in 2007. The question now is whether or not uranium can get another persistent run higher like it did before. It has had about a 70% decline from its all time highs and now is recently showing a monthly MACD buy signal. RSI is perched right under the 50 mid range and jumping above there could give added confidence to a new run.
Again, this no fast moving chart but it may be worthwhile to start looking at some of the uranium mining long term stock charts for similar evidence of a bottom.
The junior uranium mining stocks don’t have a habit of moving very fast. They tend to track the uranium price slowly over time with seemingly endless touch and go. But if the uranium price is headed for another moonshot, I would think that many of the junior uranium stocks will be a lot higher in the years ahead.
Uranium is also a long term play on the world’s energy demands. If oil spikes up again and alternative energy does not catch up, then maybe the world will start to open their minds to uranium as a clean energy source.
Jim Dines is the one who identified the market low in uranium back in 2000. His current thoughts are here.

