If you ever want to know what it feels like to be bi-polar, all you have to do is start watching the gold price on a daily basis. Two days ago gold was up big leading one to believe that a breakout may start. Then the next day the gold price took a major body blow to the downside. Then today (at least so far) spot gold popped right back up again.
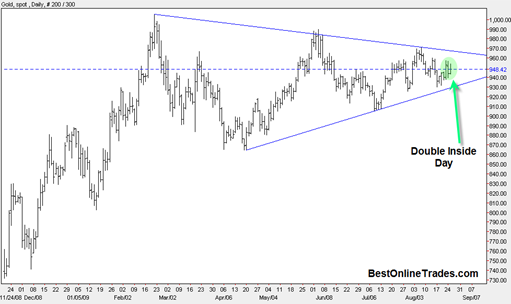
But this ‘bi polar’ type price action is accomplishing something important. It is filling in the large symmetrical triangle that has formed in the gold price since the mid February 2009 time frame. This is a large triangle and has a lot of significance in terms of the amount of of energy that is being built up.
Spot gold is coiled up about as tight as can possibly be. Right now price is right in the middle of today’s trading range. There also exists a double inside day. These double inside days are basically like small coils and can lead to big price moves in either the up or down direction. A double inside day occurs when you have three price bars and each successive price bar has a lower high and a higher low than the preceding price bar.
So we have a double inside day inside the apex of a large symmetrical triangle. That symmetrical triangle is the right shoulder of a head and shoulders bottom formation. And the entire head and shoulders bottom formation is the handle of a super large cup and handle chart that starts in the year 1980. Is that unbelievable? It almost seems to be so.
There are four trading days left in August and I continue to believe that we may see the initiation of an upside breakout on the change of month from August to September. I am making this conclusion based on the monthly pattern I see in the US Dollar Index and strong bullish seasonal stats for the gold price and strong bearish seasonal stats for the US Dollar Index.
It seems as though we are at almost zero volatility right now in the apex of this symmetrical triangle. The gold market has pretty much put everyone to sleep with this 2 steps forward, 2 steps back trading action.
But do not be fooled by this quiet price action. Symmetrical triangles, right before they break out have a tendency to catch everyone off guard. They trick you and train you into thinking that any future price move is going to also be slow and labored. But I don’t believe this will be the case at all. I think we will see a large persistent move that could see gold move $100 in as little as two weeks time.
The price levels I indicated on the GLD ETF and the DGP ETF still remain in force.
If we get an upside breakout then I would expect a strong and long duration continuation type breakout. But if I am wrong and we get a downside breakout, then a whole new batch of analysis is going to have to come into play. I have said several times before that I am biased to the bullish breakout scenario and still remain in that camp.
So lets see how things play out in the next week or two.

