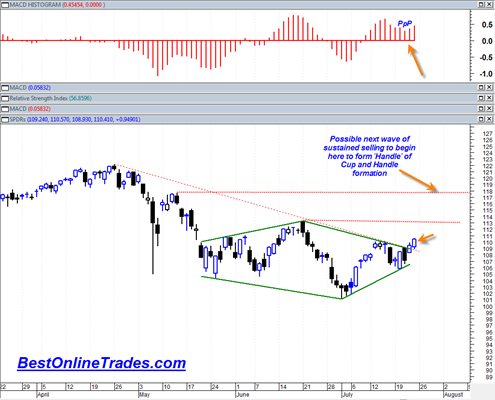
The SPDR S&P 500 ETF confirmed a bullish MACD histogram buy signal yesterday (7/23/2010) by closing above 109.94 yesterday. Not only that but the SPDR S&P 500 ETF has broken through the bear market resistance line that started end of April 2010.
This breakout was also a breakout north out of the large diamond trading pattern mentioned before. The breakout of recent days was not exactly what I consider a sign of strength in terms of price spread or volume. Both were somewhat weak. But still the market did close near the highs and above the recent resistance range of 110.06 and says the SPDR S&P 500 ETF will now likely move to test the 113.20 swing high.
I currently expect that we will successfully get through that level and move on to test the 117.62 level thereafter. From that point I expect a new selling wave to begin which is only natural because the people who bought near the April 2010 highs are still in a losing position and will want to get out of the market if they are given a second chance. That selling should create a form of handle formation of a cup and handle pattern.
The McClellan summation index powered higher yesterday also and is confirming the recent price strength.
Whether or not the August 10th to 12th cycle date proves to be a massive bearish turning point remains to be seen. It could mark an important high. But the issue is whether or not it leads to downside follow through. The answer to that question is going to rely on whether we are about to continue into a massive new bear market phase OR the exact opposite (a strong bullish phase).
Despite my current bullish tendencies, I will remain open minded as we get near that date. In fact near that August 10th to 12th, if the market trades strongly right into that date it may be a worthwhile place to short the market.
But for now the bulls once again own the open road in my opinion.


MACD is a not a leading indicator. This could easily become a divergence – with SPX making a higher high and MACD making a lower high, as there is plenty of resistance overhead. But then again you have to respect the break of the trendline and the diamond. My take is that whipsaw is the theme until mid Aug.
Arsen
I agree with your whipsaw conclusion. I think the ultimate direction is down. I am holding my short positions and TZA, for example.
Almost all my short positions now have Slow Stoc at around 80 level.
One Kitco commentator late last week indicated that IMF was to send in a team to investigate if Greece deserved a second tranche of some loan. His conclusion was it would be impossible for them to grant the next tranche. If his commentary and conclusion is true, it could set off another round of Euro instability and the irony would be so soon after result of Stress Test.