The gold price and the SPDR Gold Trust (ETF) continues to be situated in a potentially pivotal position from both an intermediate term and long term basis.
The question is whether bullish seasonal tendencies should be given more weight or the gold chart structure itself? The 34 year seasonal tendency especially from mid September onwards is very strong for gold.
I think we have to focus on the chart itself, the levels, the supports, the trend lines and the volume for guidance. Bullish seasonal tendencies are nice to have if you are long, but relying on blind faith just because of seasonals is probably a bad mistake.
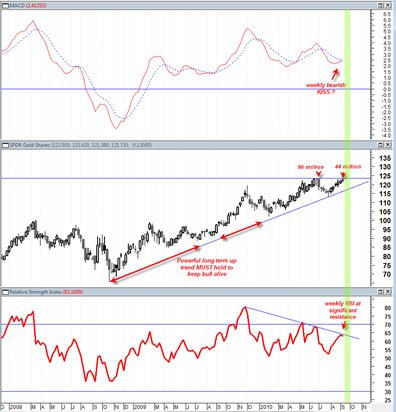
The weekly chart of the SPDR Gold Trust (ETF) shows that the advance that began since beginning of August 2010 has been on very lackluster volume. Still weekly price has advanced in 6 out of the last 7 weeks and weekly price has managed to perch itself just under all time highs resistance level of the 123.50 range.
This weeks total volume came in at 44.8 million shares. The highest previous weekly price swing at this level has a total volume of 96.4 million shares. This week we were not able to get price of the GLD above the 123.56 level which would have represented a true test of 96.4 million share weekly swing, but still I have to say that it is somewhat of a concern that we are pushing near the previous highest volume weekly swing on 53% LESS volume.
The weekly chart of the GLD ETF above shows that weekly Relative Strength Index is right at the level of previous down trend resistance. It also shows that weekly MACD appears to be ready for a bullish upside cross. The weekly macd upside crossover has not officially occurred yet and there is always the risk that it will turn into a bearish KISS instead of a bullish crossover. I expect this to be determined by the next weekly candlestick bar to be completed by end of next week.
Even if the gold market initiates a down week next week it still remains true that the gold price is still supported by the longer term up trend line since October 2008. This line has not yet been violated and remains constructive.
The daily MACD is in a bearish stance right now and does suggest that price should retrace downward next week. So the question is does gold have enough seasonal strength to evade the daily bearish MACD cross and initiate a bullish MACD weekly crossover and bust WEEKLY RSI northward above resistance ?
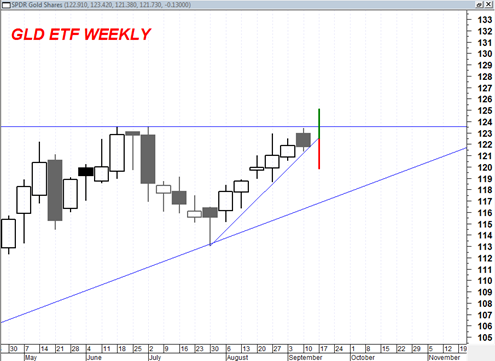
The gold market will start to provide the answer to this question early next week as the weekly candlestick starts to form:
The chart above shows the weekly candlesticks and shows that next weeks candlestick is going to be the determining candlestick that shows the gold price is either ready to breakout to new life time highs or retrace back down into the lower pocket. The combination of the more recent up trend line beginning in early August 2010 with the topline resistance at the 123.50 range defines this ‘squeeze’.
The green and red line I have drawn in the chart above indicates the possible weekly price extensions next week. The 53% volume shrinkage I pointed out earlier in this post ( in addition to the bearish daily MACD) suggests that the gold market will fail to maintain this near term uptrend next week and choose the red colored bar as its direction.
A down September for gold would be quite unexpected given the structure of the current setup. It would go against the tendency of the last 3 yearly September time frames which resolved bullishly. A down September could be an early warning sign of a character change in the gold market.
The end of next week will be a very important clue as to how the gold market situates itself before the last quarter of this year. . .


