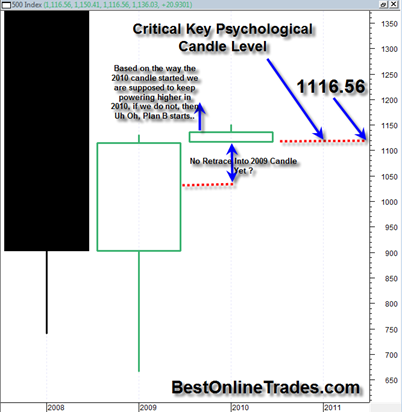
It is a bit funny that only a day or so after I write a post on the yearly 2010 SP500 candlestick and how potentially bullish it would look if we do not violate my indicated price point of 1116.56, that the market today decides to show some weakness and possibly, I say possibly set up a challenge of that level in the weeks ahead.
I indicated in that post how important the 1116.56 level was in terms of candlestick psychology interpretation. Could it be that we are going to break below that level and start to create a bottoming tail for the yearly 2010 candlestick? Indeed, that would make the market dynamics very interesting going into early 2010.
I said before that the yearly chart price candles or price bars are not really tradable, but in fact that may not be true. There is a certain degree of tradability based on the dynamics of how the 2010 candle is forming and may continue to form going forward.
What I mean is that because we saw the open exactly equal to the low of the 2010 candle so far, one would expect the SP500 to continue that type of yearly candlestick strength without delay. But if we now turn around and violate this value of 1116.56 (the opening low and open of 2010) then it will start to create candlestick price retracement into the 2009 candle bar. So that would be the exact opposite occurrence one would normally expect after seeing a market rally higher from day one of 2010. To me the psychology interpretation is:
“The open of 2010 is exactly equal to the low of 2010 so far…and we are trading higher above this level creating a bullish looking candle.. but wait.. oh no.. what if we start trading below that opening level… hmmm.. I better sell now..for fear of more retracing and selilng into the 2009 candlestick”
If you look at candlestick charts on a real time basis on shorter time frames like daily time frames you can easily see what I am talking about here. Every time you finish a daily candlestick, usually the next day’s candle retraces at least a little bit into the previous days candle. It is a very normal thing to occur and quite probable. The times when you do not see any retracement at all into the previous day’s candle are rare and occur when you have very strong breakout type markets, running gaps, or just simple very persistent bullish price action.
We are only about 20 S&P Points away from this critical value of 1116.56 or about 1.71% away. If we are truly entering a bearish phase now that level could be taken out in only a day or two.
I went long the TZA today on the chance that this short side will work this time. The volume today was quite heavy once again, but again the problem is that there is still not enough price destruction to accompany these higher volume down days we have been seeing off the top. So lets see how the market shapes up the January 2010 monthly candlestick and whether the critical levels I mentioned earlier come into visual range.
I doubt you are seeing discussion of the yearly candlestick parameters like you have just read in this post…
On the Entire Internet !
But that is the style of BestOnlineTrades, unique insights and interpretation you probably have not read anywhere else…
So who says you can’t trade based on yearly candlestick charts! The parameters I have outlined here seem tradable and ‘signal worthy’ enough to me!

