The sp500 on the long term charts is at a potential turning point. The quarterly price candlestick which ends in June 2013 is at risk of forming into a ‘shooting star’ candle stick with a long topping tail. While this does not guarantee we are at a major turning point, it does warn that we are at risk of a trend change if the follow on quarter is bearish.
There is a very important cycle turn date of August 8, 2013 which is important to gauge as we move closer to that time frame and see how the charts are shaping up into that time frame.
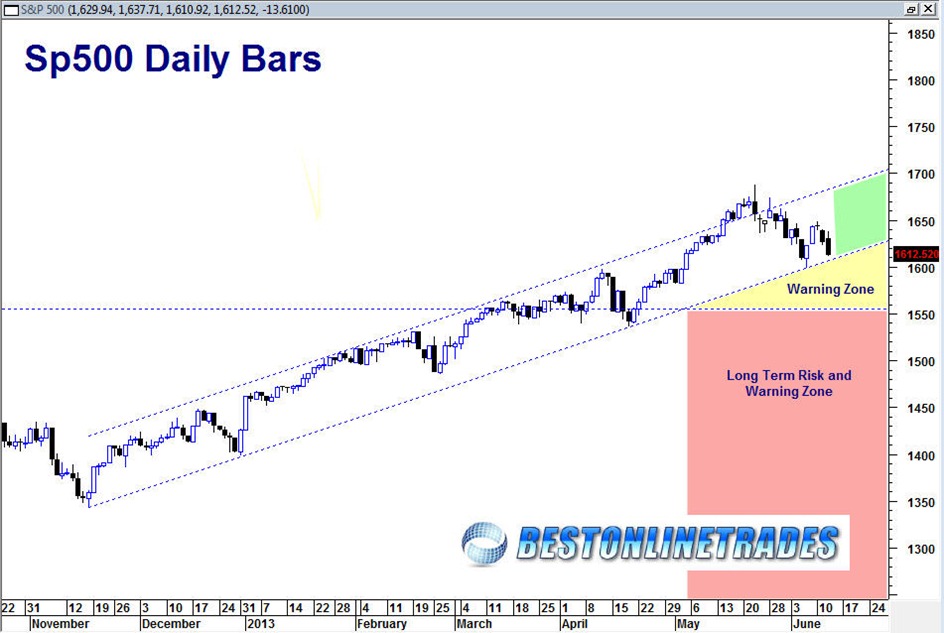
In the near term the sp500 is at risk of moving into a break of the up trend channel (yellow shaded region).
If the sp500 moves into the red shaded area it would be quite more bearish on the longer term time frame because the red shaded area marks a break of 13 year support and is the breakout area of the 13 year long trading range.

