The sp500 is still looking very weak and now the bounce scenario seems on very shaky ground. The FXE Euro ETF also violated very important pattern completion points on the downside today and because of that could open the door to much lower FXE targets. The UUP US Dollar Index was strong again today and the TLT exploded higher. We have heard this song before and it sounds like the tune of lower USA stock market prices.
Interestingly gold held firm today near its pattern completion point.
So what now ?
I am once again back to the bearish rising flag theory.
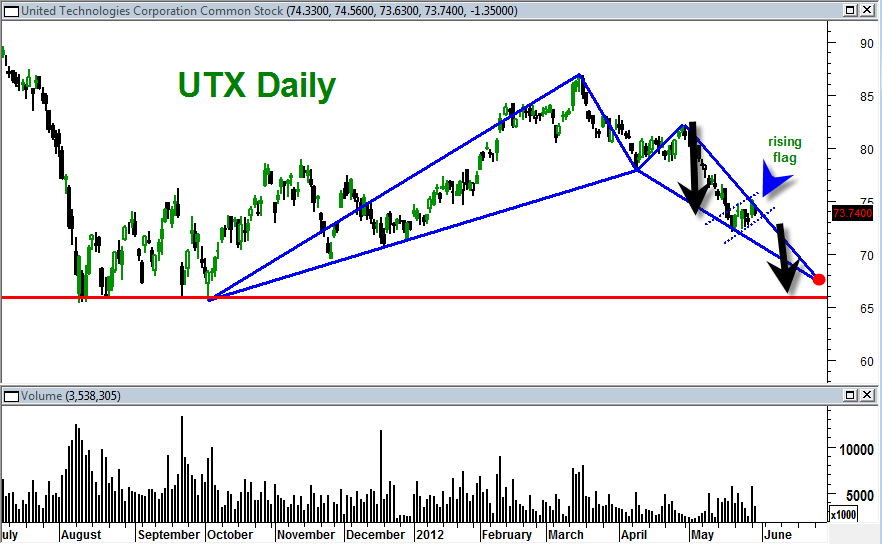
There is a pattern on UTX that shows a pattern completion point near important support range of 2011.

The solid red line is the important support range and the red dot notes the 1.618 completion point from the March highs. Note also the rising bearish flag pattern.
On the sp500 a 1 to 1 AB=CD down from the May 1, 2012 swing high would lead to a projection point on the sp500 of 1211.59. The 1211.59 on the sp500 is an outstanding support area and makes a lot of sense for the sp500 to get there in a 1 to 1 AB=CD down. The 1211.59 also makes sense for a repeat measured move out of the flag pattern which is typical.
Flag patterns are not usually that reliable if they last too long. So ideally this flag is done now and then downside would ideally resume again as we head into June. The change of month into May June is coming as well which is important for the MACD histogram structure. It is possible we could get a confirmed MONTHLY MACD histogram sell in the month of June 2012.
It seems clear that this is a slow motion bear market right now. 1211.59 on the sp500 looks like a magnet to me now. It might even have a shot at getting there in June 2012.
