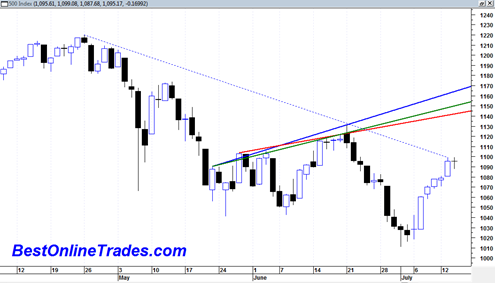
The sp500 is sitting right under the medium term resistance line that has marked the downtrend since end of April 2010.
Today was pretty much a non event day in terms of price movement and the sp500 printed another doji candlestick with a modest range. It was also an inside day in that we did not exceed the high or the low of yesterdays price action.
Again, we are sitting right under the medium term resistance line that has basically defined the bearish move since April 2010. The fact that we did not show a strong reversal type candlestick today is encouraging for more upside action. It is also good that we did not exceed yesterday’s high. It allows the market to build a small amount of energy for a possible ‘jump of the creek’ , the creek in this case being the blue dotted down trendline.
Based on the shorter term momentum, and the market still feeding off of this positive divergence I am thinking right now that the market will be able to jump over this blue dotted resistance line this week and then make an attempt at one of the three other topside resistance lines that have defined the inverted triangle.
If I am wrong, then the market should tell us this tomorrow and reverse down immediately telling us that it still wants to respect this bearish downtrending force.
We are certainly at a very interesting juncture here.
I continue to see bullish tendencies on the weekly chart plotted against the MACD histogram. All we need to do this week to confirm the weekly upward histogram buy signal is to get a weekly close above 1078.16 on the sp500. So far so good but the week is not over yet.


Thanks Tom. I find my name mentioned in other post.
Looks to me that S&P will reverse at 1146.7 (I am speculating on this figure) intraday. If S&P shoots above 1153 intraday, I am wrong somewhere.
FED will probably come up with some package in next few days and that will mark reversal.
Sounds like a good reversal number Shrihas. You have made some very good calls lately. An interesting juncture we are at now.