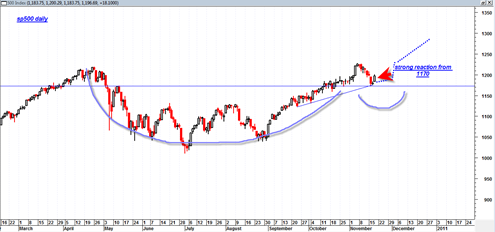
Today the sp500 showed a serious sign of strength and rejection of the 1170 level. I talked about this level in yesterday’s post as being important in terms of support and possible handle support of a very large cup and handle pattern.
Today created a bullish triple P in the MACD histogram which would be confirmed with a closing above today’s high. The ‘false’ bullish harami cross I mentioned yesterday appeared to work today. Ideally for the bullish case, any pullbacks from here will be in the form of a higher low, and then off to the races again.
I am going to keep the BOT Long Signal at 1206 intact for now as I think we are going to continue to create a handle of a large cup and handle pattern. This should result in bullish activity into the end of the year.
The market seems to want to take quick advantage of heavy oversold levels and pounce on them higher straight out of the gate. This is not a good environment for shorting. Rather it continues to be a ‘buy the dips’ type market for now.
I suspect that the right half of the handle will be created quite quickly. At this time I am not expecting endless sideways battles that keep us range bound for 20 days. Rather, I expect a market that wants to charge higher and not waste any time.
According to Investor’s Business daily:
The handle should form in the upper part of the entire pattern. If it’s too low, it’s flawed. It should be sloping downward along its lows, not upward.
This handle has clearly met this condition. This handle is way up in the clouds in relation to the entire pattern. So this recent decline looks like a simple pause in the trend.
The summation index continues to show that momentum is still trending down. The problem is sometimes the summation index just gets dragged higher with mini corrective legs while the market just keeps pressing higher. It definitely makes market timing much more art than science. But if there is anything I have learned during the last few months, it is that one must try to focus on price itself as much as possible as the leading indicator. Most technical indicators and even the summation index have a habit of lagging the ultimate direction of the market.
Next week is the holiday week and the current setup suggests that next week will be an ‘up week’. It reminds me a little bit of 1999. I remember then that bundles of stocks literally went vertical the day after thanksgiving. I don’t know if we can manage something like that again, but the setup potential is there.
So again, for now I am thinking we trend higher into end of year with the market getting new upwards running legs by December at the latest.


Tom,
We are at a 2.0 STDV Channel if you draw it on a daily chart for the past year.
In addition, the SPX reversed right at the 1228.76 .618RT to the 1576 bull market high from the 667 bear market low after the 1227.08 high on 11/5.
So, I wouldn’t bet on SPX going much higher than 1250 H&S price objective.
Interesting analysis Arsen. I have not been keeping up with the Fibonnaci side of the market as much as I used to but looks like you make a good case for 1250 stopping point. Nice work.
I guess the issue is, the longer the market hovers above the April 2010 highs, the more it creates the scenario of a follow on move… ideally for the bear case we will not be able to push back above the April 2010 highs for too long a time frame.