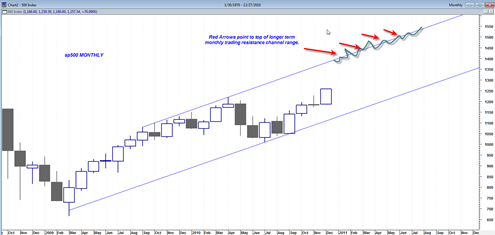
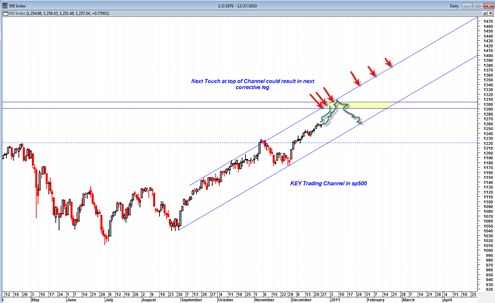
The sp500 is trading in a somewhat narrow trading channel and appears to be bound for the top of the channel before any new extended correction takes hold. There is an important resistance band near 1290 that may also contribute to slowing price momentum.
A successful 3rd touch of the bottom portion of the up trend channel would be quite the accomplishment for the sp500 as we move into 2011. A successful 3rd touch and bullish reaction off of the bottom channel line would position the sp500 for higher ground later in 2011.
For now though the sp500 should be watched for a possible move to the top of the channel as a catalyst for some profit taking reaction back down to the bottom channel line.
There is also a very key price swing in 2008 of 1265 which marked the swing right before the super plunge into October 2008. How the sp500 reacts at that range could also be a telling clue whether or not we will be able to move to the top of the channel or not.
The monthly candlestick chart shows that the sp500 may start to develop much more labored upward momentum after the March to April 2011 time frame. The ‘sell in May and go away’ theory would seem to be supported by looking at the monthly channel chart.


I see a rising wedge, not just a channel on the SPX.
The VIX is bouncing off a 3 year low
The Hindenburg Omen has been triggered again
We should be rolling over soon
Yes VIX is somewhat bouncy lately, but summation index is in bullish mode for now and Dow Transports this long sideways action.. makes me still wonder if bears can get enough ground yet…