The S&P 500 Index managed to achieve a mediocre bounce from the shorter term bullish gartley pattern discussed a few days ago. The jury is still out on how strong of a bounce this will be, but early indications are telling me it will be a weak bounce and shorter lasting.
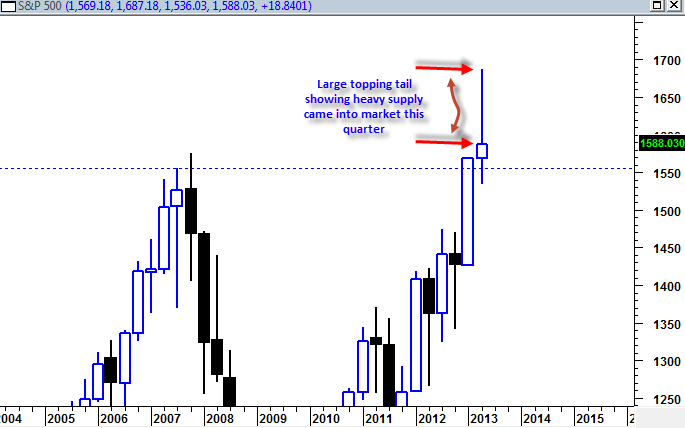
If the nature of this bounce is generally weak and failure prone then we have to consider the possibility that the quarterly price candlestick (which completes in 3 trading days) will remain with a very bearish potential looking longer term signal. The emphasis is on the word ‘potential’ because even if we do get a quarterly shooting star type candlestick with a long topping tail, one has to be careful about presuming that it will imminently lead to fast and rapid price destruction.
I have seen plenty of large reversal hammer or shooting star type candlesticks that lead to false signals. Whether this one leads to a false signal remains to be seen.

The first sign on the longer term basis that this reversal candlestick will fail as a signal will be a maintaining of price above 1550. Closing below the low of the price candlestick is a sign that this candlestick bearish signal is valid. But price action that shows extreme reluctance to trade below 1555 could be a sign that this candle is a false signal.
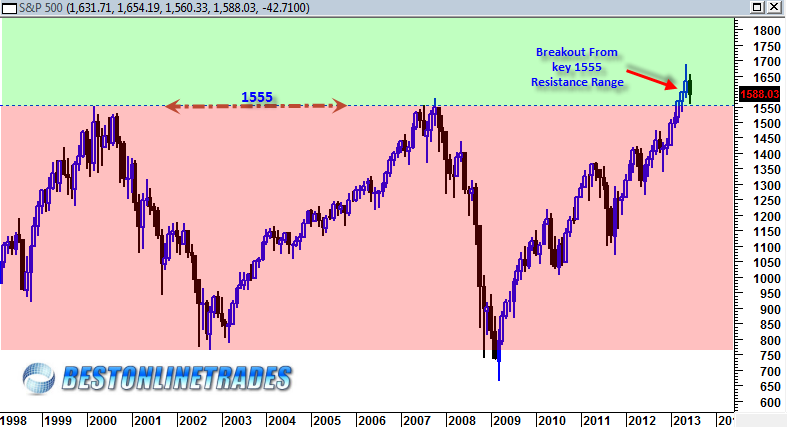
Aside from the quarterly signal we still have to consider the long term monthly price action since the trading range began in the year 2000. This currently quarterly price candlestick represents a monthly price action northward breakout of a 13 year trading range. This is important because the market has told us that it has made a significant northward breakout from a 13 year resistance line with a sign of strength.

It is important to keep in mind that a price action decline to the 1550-1555 zone would be perfectly normal price action as long as it does not drop below the 1550 level. On the monthly chart above we are in the process of declining towards this 1550 zone. This is the markets attempt to test the breakout area, a very common occurrence in market indices and individual stocks.
The testing of a breakout area is really the ‘moment of truth’ for any stock or index because it describes a situation where the market or stock is trying to make a determination if the breakout was valid or not. If the breakout is valid, then the price decline to the breakout area represents a good low risk entry zone for more eventual upside. But if the price action shows ease of movement towards and under the key breakout line then one has to start to question the validity of the breakout and start to ponder more bearish possibilities.
So key is to keep a still open mind as we move forward.
I have to admit that the prognosis does not look very good considering we are soon into the low volume slow July August 2013 trading period and also getting closer to the possible key August 8th, 2013 Armstrong cycle turning point (at bottom of page). In addition to that we have the traditionally weak and negative seasonal time frame of August to September for equities.
So any bounce from here, perhaps starting in July 2013 could conceivably lead right up into the August 8, 2013 turning point and then lead this market to a swift fall, potentially confirming the bearish implication quarterly reversal price candlestick.
But again, I don’t want to put the cart too far in front of the horse yet… lets see how the quarterly price candlestick officially closes this week.
