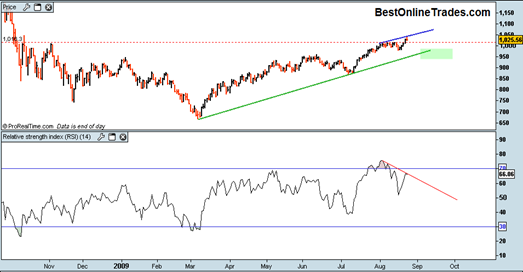
The S&P500 had an intraday reversal today and price closed near the opening price creating a reversal hammer on the candlestick chart. But perhaps more significant than that the S&P500 created this reversal hammer early in the week and has created a possible short term bearish divergence between the relative strength index and the S&P500 closing price for the month of August.
There are only 5 days left in the month of August not including today and it has me thinking some sort of correction may start here. The follow through sign that a correction will continue is if the relative strength index fails to make anymore upwards headway and if the SP500 breaks down below minor support near the 1014 level.
I could be wrong, but I still think the SP500 has a good shot at getting some kind of touch of the green up trendline in force since March. Perhaps we will drift sideways the next week or two or three. That would get the relative strength index sold off enough to possible reset the market into a more bullish stance from mid to end September onward.
I am just thinking possibilities here, especially in this somewhat tricky seasonal time frame. I did see quite a few bearish reversals in many individual stocks today.
I still believe the market eventually goes significantly higher than where we are today but I would love to see it accomplish that mission from a third touch and test of the green up trendline.
The market as of late has had a tendency to work off overbought levels by going sideways instead of embarking on more severe downward corrections. I cannot rule out that this will happen again. The first hint that it will do it again is a holding of 1014 level without breaking below the next couple of weeks.

