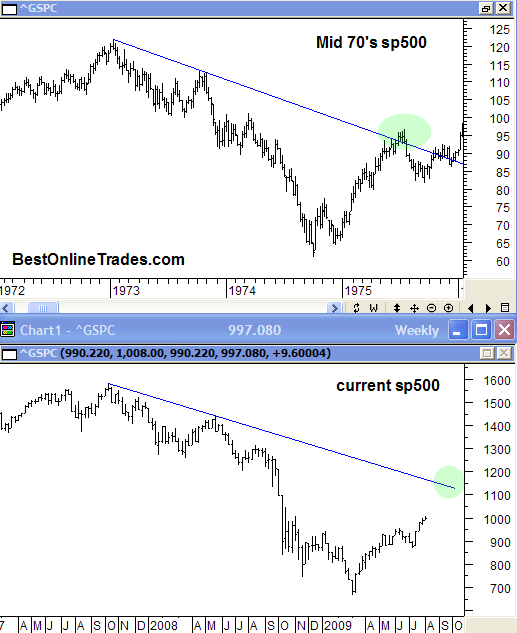
I already posted similar charts to the ones above but I am doing it again just to keep them fresh in my mind and maybe yours too. I continue to think that the SP500 in the current time frame is going to be able to get right back up to its longer term bear market trendline.
The Nasdaq Composite (not shown here) is already right under its trendline and in my opinion leading the way for the SP500 to do the same. So this could potentially mean that maybe by the end of this year or very early next year the SP500 is able to get back close to the 1100 to 1150 area. I am thinking right now that the end of the year is plenty of time enough for the SP500 to get back up there. By the way both of the charts above are weekly price bar charts. It would seem it might take longer than that especially if it is a more labored type advance.
If you look at the rally in the mid 1970’s you can see that price briefly and initially pierced through the down trendline (making it weaker) that defined the large bear market. Then the SP500 went into a more involved correction that broke back under the trendline and consolidated for about 5 months before moving higher again.
The strange part is I expect something similar to happen to our current SP500. Looking that far out is a very improbable science but that is my take for now and the one I intend to stick with.
If you think about it, the scenario I just mentioned is maybe not the most widely expected ? The market needs to do what is not the most widely expected. When and if the SP500 gets back up to that down trendline, there may be a lot of folk who think the bear market needs to resume from there especially if price breaks back under the down trendline after initially breaking above it.
But that is what happened in the mid 1970’s, so why can’t it happen again this time? It can and it probably will. Oh yea and there is also this ‘unofficial rule’ that usually on the third test of a resistance area you will get a successful break through. So the SP500 coming back up to the down trendline would be the third attempt. But we will have to re assess down the road and look at other factors as well.
Looking at past market action can be a double edged sword. Yes it is useful for comparison and analysis, but it also needs to be handled with care. Just because the SP500 did A or B in the mid 1970’s does not mean it has to do the same now. But the structural similarity between now and then is just too similar to ignore.
