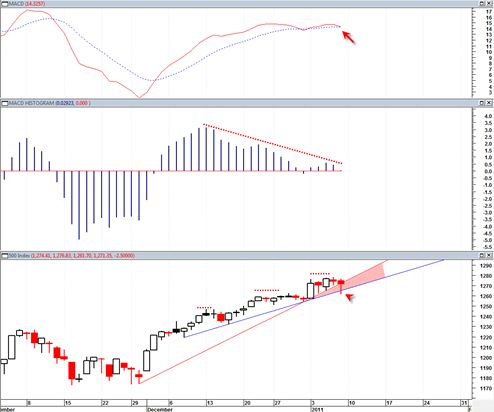
The sp500 today reversed a good portion of the losses today and at first appearance appears to have saved itself from any potential downside damage next week. However the daily MACD is at a bearish crossover point and there exists a triple bearish divergence between the MACD histogram and the sp500 of the past few weeks.
Also today the sp500 at its lows slightly pierced under the two up trend lines that have been carrying sp500 higher since the beginning of December 2010.
This piercing could be a possible warning sign that these two uptrendlines will be broken with more conviction next week.
Also possibly troublesome for the market is the recent strength in the US dollar index. It has formed a bullish flag pattern and could see some continuation moves up the next weeks.
The red shaded area in the chart above is where the violation occurred. My view is that this piercing should not have occurred if the market was going to power higher again in strong trend fashion off of these up trendlines.
The closing candlestick today on the sp500 looks like a reversal hammer but it is actually a hanging man candlestick which would be confirmed with either a gap down below it sometime early next week or a simple close below today’s low.
The downside volume in the XLF financials ETF was enormous today which is another warning sign. You usually never want to see enormous downside volume in anything right near the top. It is usually a warning sign of trend change.
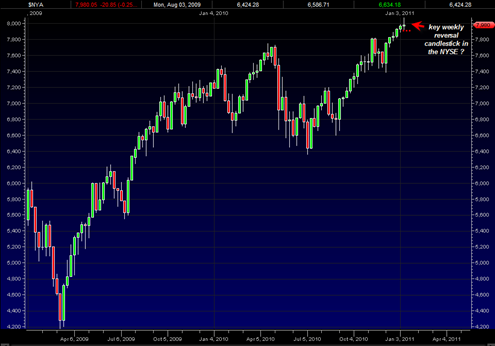
The NYSE composite index has a possible weekly reversal candlestick as of today but would need to be confirmed with a weekly close below this closing weeks low point.
The NYSE has made a habit of ignoring quite a few of the previous weekly reversal candlesticks so we will just have to wait and see if it is able to do so next week as well.
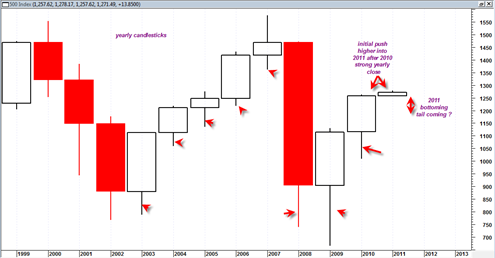
Finally when we look at the YEARLY price candlesticks we can see that the sp500 has still not formed any bottoming tail whatsoever on the 2011 candlestick. Of course we are still very early in the 2011 trading year, but it would seem that some type of bottoming tail could start to form in the next few weeks. This could equate to 5 to 10% correction in the market before demand kicks in again.
If you have ever watched daily candlesticks charts in a real time charting program you can clearly see how bottoming tails are formed on the next sequential candlestick. If the previous candlestick closed near the highs one typically sees the next candlestick start with an initial up surge.
Then, there tends to be a quick retracement back into the previous candlestick. Then comes of the moment of truth. If there is enough demand and enough conviction for more trend higher, then that retracement will turn into a bottoming tail which is bought up and then the market resumes its uptrend.
Note how large the bottoming tail was on the 2010 yearly candlestick. I have no idea if we would get such a large bottoming tail like that this time around. We will just have to wait and see.


