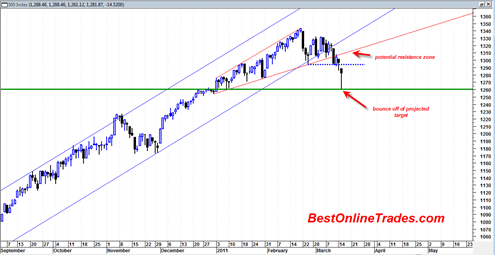
It looks like there is a strong probability we have created the first tradeable low in the sp500 today on this panic of the Japan earthquake and nuclear situation. I wrote in a previous post that the sp500 was forming an important broadening wedge formation and that the ideal target for the drop is the 1260 to 1270 range which would be the beginning formation of the broadening wedge. As it turns out this is almost exactly what happened.
Today had the flavor of a panic high emotion low with very heavy volume.
The ARMS index today hit an intra day high of close to 12 which is an astounding amount of intra day fear and helps argue the case that we are near an important trading low. I believe that is only the second time in history that the ARMS hit such a high level.
My understanding of the rising broadening wedge formation is that it does not necessarily have to be a major top, it can simply also be a corrective formation within an uptrend. This is important because I still think it good to keep an open mind about the nature of the current correction.
I suspect we will bounce higher in the sp500 tomorrow 3/16/2011 and then maybe by end of day sell off in the form of a reversal hammer. That would set up a drop into the full moon of either this Friday or Monday of next week which could be either a higher low or a new low. I suspect it will be a higher low that marks the first bottom of this decline phase.
1295 appears to be strong resistance now and is likely to be sold into if we get a bounce into that zone tomorrow or later this week. It is an important resistance level now as we see whether the market wants to be bullish or bearish.
Is there still a strong bullish case? Unlikely, however if somehow the sp500 can manage to blast above 1295 this week and then STAY above this level it would essentially have created a 2B buy signal and make today’s decline simply an outlier panic one day move. I view this as a very remote possibility for now.
So again, ideally the more sustainable low will form either end of this week or on a low volume Monday 3/21/2011.
The ideal exit point for shorts was near panic low today, but I think shorts will get a second chance to exit on the above mentioned higher low that should come in during the next 4 trading days.
At that time I may start a short term BOT Long signal but I need to see how the tape evolves first.


I have absolutely no idea what you are talking about vis a vis the ARMS Index. The Arms / Trin closed the day at a very benign 1.23 (i never saw it much over 2.0 during the day). More importantly in my opinion, the 10 day moving average of Arms / Trin is in neutral territory of only 1.10!
On Kitco website today (March 16th) there is commentary by Greg Hunter where he refers to recent commentary of Martin Armstrong who is calling for collapse of currencies
Yes unfortunately etrade was giving me bad data. I am going to have to refer to stockcharts.com from now on for that data.
Actually stockcharts.com also shows the intra day high spike of 12 to 13 level so it may be correct… I am not referring to the closing ARMS, I am referring to the intra day high value of the ARMS.
http://stockcharts.com/h-sc/ui?s=$TRIN&p=D&b=5&g=0&id=p37026682045