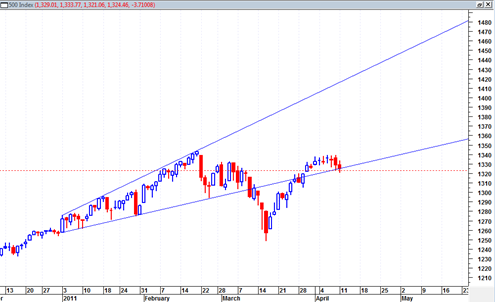
The sp500 is drifting slightly down to sideways and is again flirting with the boundary line of the large broadening wedge formation. We did not close below the broadening wedge line today but came pretty close.
A close under 1323 this week will confirm a weekly bearish MACD histogram signal and I really do not know if that will happen this week. But I will say that if we close down hard tomorrow that likelihood will start to become more probable.
This is a tough area of the market. A big move up tomorrow would ‘save’ the market to a certain degree and keep it trending within this broadening wedge.
I think it good to keep open minded about the possibility that we are trading range bound now between 1340 and 1250.
If the current consolidation fails and starts to break down tomorrow it could be that we are going to make another move towards 1250.
The March 16, 2011 SPY volume was 470 million shares, a very high spike volume number showing heavy price action, participation and capitulation.
The rally since that swing low has drifted back up to the highs and seems to be struggling. It would not be so uncommon for a retest of this high volume swing low on March 16, 2011, assuming we fail to push higher anymore on the current mini consolidation.
A decline all the way back down there is only a theory for now for me. The red horizontal dotted line is the weekly MACD histogram confirm or no confirm sell signal.
If by tomorrow between 3:55PM and 3:59PM we are closing hard down I may have to issue a BOT Short Signal on the sp500.


I think a more sensitive guage of a possible decline is Russel 2000 (IWM ETF). IWM better make a stand tomorrow 🙂 It has been going down on declining volume (which is a plus), but is going down.
Will see what tomorrow brings.
yes i need to do an updated post.
I think we go down now to test the earthquake lows.. that was a high volume swing low… it is a magnet..
i am thinking now we bust down there…