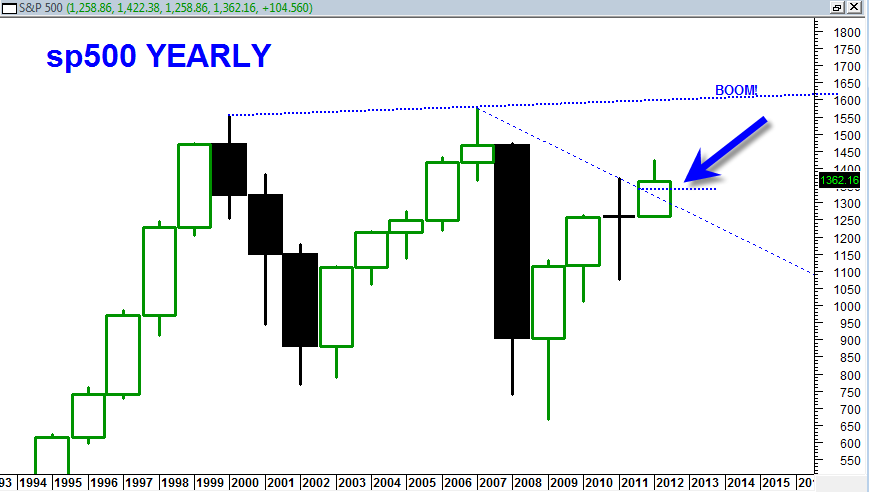
The sp500 finished the quarter and month this past Friday with a bang. It was really quite impressive and the huge up day we had June 29, 2012 should be respected and taken exactly for what it is… A valid sign of strength and kick starter to a new up leg going into the election 2012.
This market is going higher into the election. I do not see any other possibility unless the market starts to fail badly at the previous 52 week highs again. It will be very interesting to see if the market can manage to get back up to the 52 week high range on the sp500 before August 2012 starts.
Secondly it will be interesting to see how the market is able to weather the traditionally seasonally weak August September 2012. My take is that we will blast higher to new 52 week highs all along the way. The longer term charts are pointing this way.

It is AMAZING that one day of trading action can mean so much in the sp500. The June 29, 2012 huge upward surge shot the market into a substantial quarterly breakout above the longer term 2007 bear market line as shown in the chart above. This is clear conviction in my view that we are at a valid breakout now and will continue higher, possibly to max level of 1600.
The TNA Triple long Russell 2000 ETF is looking quite ideal at this juncture.
The most difficult part of market analysis is WAITING for clear signals such as the one we had 6/29/2012. So much of the price action before that was NOT decisive and yet probably many traders were making strong bearish or bullish bets. But a day like 6/29/2012 is like wind at your back… it is the evidence needed to give more confidence on trading the long side.
For me the next two MAJOR challenge zones or resistance points for the sp500 are 1470 and slightly under 1600. Of course it will take plenty of time to get to those zones, but I think they will be key as far as potential resistance zones and/or turning points.
I am Seeing Many Dow Jones Industrial Stocks that are Looking Very Bullish Longer Term
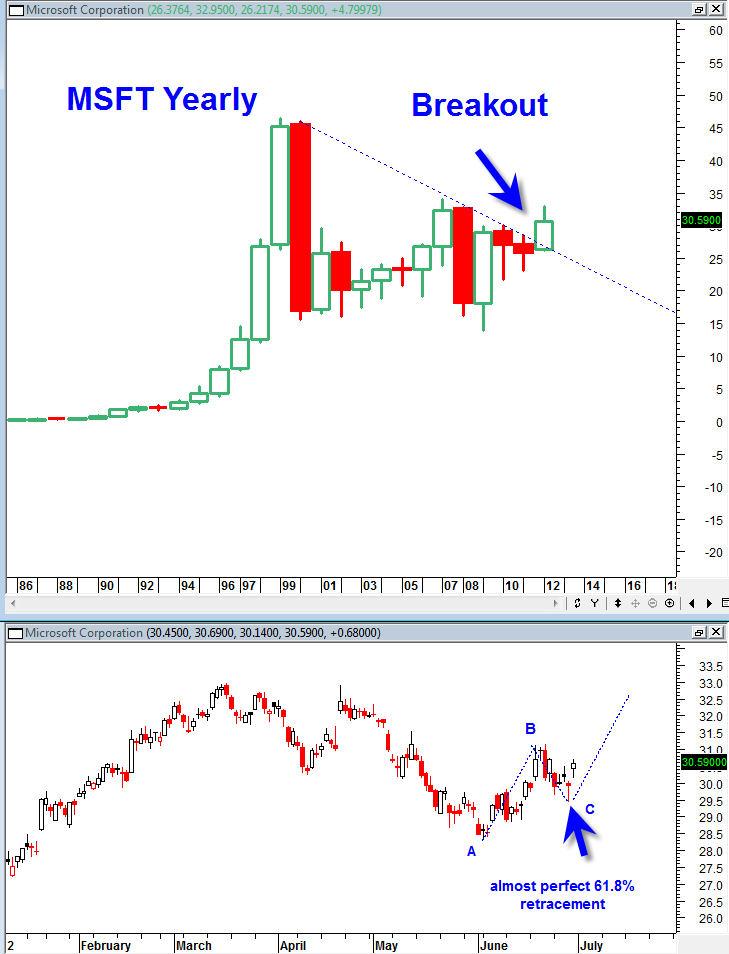
Take Microsoft MSFT for example. It has a bullish breakout on the yearly basis from the bear market that started in the year 2000. I feel confident enough to say that MSFT is a great long term buy from this zone. I suppose you could call this a very long term position type trade. Microsoft is a slow mover but for most conservative type investing the buy zone is right here and now in my opinion.

I will leave it to the fundamental analysis experts to figure out why it is getting ready for a huge multi year run, but their new tablet and windows 8 may have a lot to do with it. Their new tablet looks quite amazing and I personally think it will take a nice size bite out of Apple’s seemingly endless tablet profits.
The Microsoft tablet has a nice attachable keyboard which is long overdue from the slow and clumsy screen keyboards on most tablets.
This table will probably be a huge growth driver for windows 8. They also claim that the tablet is designed to run best in class windows applications as well so this tablet definitely seems like it is not just for browsing or ‘apps’.
It is not just MSFT that is looking good. Walmart and Merck also are looking really good on the bullish side. There are huge patterns developing and huge LONG TERM patterns that are looking quite bullish.
Context is everything. The truth is that we have been in a large bear market trading cycle since the year 2000. Whether 12 to 13 years marks the end of that cycle remains to be seen. 12 years of corrective price action is still quite a good chunk of consolidation and at least potentially creates good long term entry points in many big stocks.
Once again, technical analysis seems to have triumphed over the bearish ‘news’ smoke screens…
