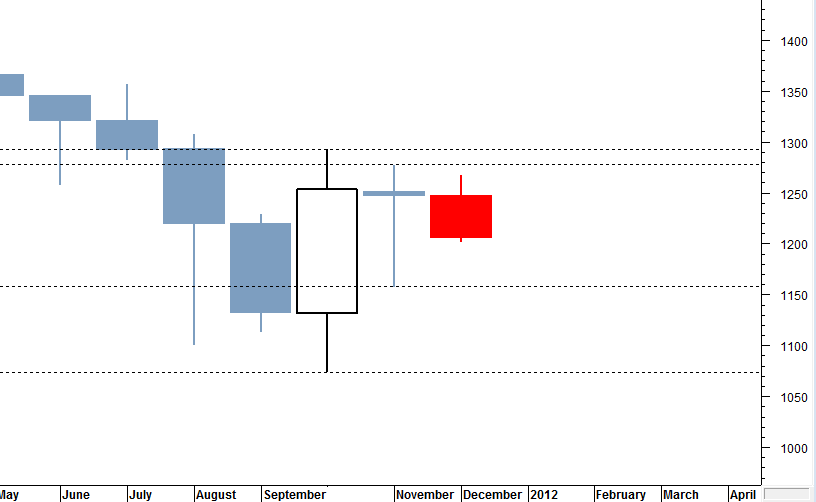
The monthly sp500 chart is currently showing that the sp500 is trading in the form of a double inside month candlestick pattern which essentially means that the market is coiling up on the longer term monthly time frame.
Today’s big rally still keeps the pattern in the form of a double inside month. This is only the second double inside month candlestick pattern since 1980. The last one was July 1991. A double inside month does not have to mean the market will surge into high volatility the following month but it does suggest that probability exists more strongly.
The double inside month also does not speak as to the direction outcome of the pattern (either up or down). It could go either way and is probably as variable as a symmetrical triangle pattern.
But if this double inside month is a probabilistic indication, then it suggests that January 2012 will be a wide range price bar month with higher volatility in the suggested break out direction.

Note in the chart above the two most recent price candlesticks show a lower high and a higher low than the preceding price candlestick. The current trading candlestick month of December 2011 is not quite finished yet (7 trading days remaining), so the pattern may morph into a breakout as we finish December 2011 or upon the initiation of January 2012.
It will be interesting to see which way the market decides to break from here. It will be a very significant trend signal for the sp500 as we start 2012.

