The sp500 continues its typical bullish tendencies since BestOnlineTrades decided to re instate the BOT Long signal on 4/18 and 4/19, 2011. The sp500 is in a bullish trend and I expect it to continue to act this way for the duration of May and perhaps part of June 2011.
The NYSE summation index is crossing bullish again and should help to keep the wind at the back of the sp500 for a while going forward.
The market is essentially on auto pilot now and there is an outside chance that it may start to trade in a rather steep northward parabolic fashion. This is just some early speculation on my part. I don’t know for sure if the market will trade in typical two steps forward and one step back or if it will trade in 10 steps forward and 1 step back. But I am speculating that it may move higher at a faster rate now.
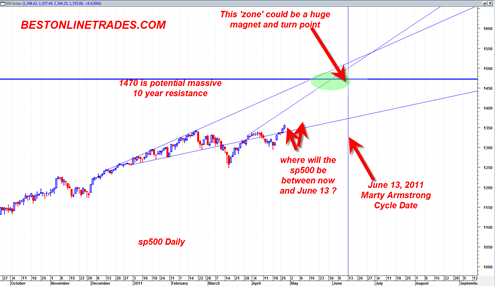
Unknown is if the sp500 can reach 1470 by June 13, 2011. It is somewhat of a longshot based on how the index trades, but if we move into parabolic then maybe it could be possible. The solution? Simply wait and see how the market shapes up into this time frame.
For now my theory of topping action by June 13, 2011 is just that, a theory. But this theory holds for either the sp500 or the gold and silver market. The vertical nature of the gold and silver market tells me they may align with the date and turn hard on that date for a unique shorting opportunity. It may be a massive short opportunity in the metals near that date… we shall see.
The chart above shows the dynamics. We see the vertical blue line at the June 13, 2011 date. The sp500 is currently trading back inside the large broadening wedge formation and is likely to trade back up to the topside of this formation now. 1470 is the key resistance level I am focusing on at this time.
We just have to let the market ‘do its thing’ and trend higher here. I do not see any top at this time. . . Stay tuned.

