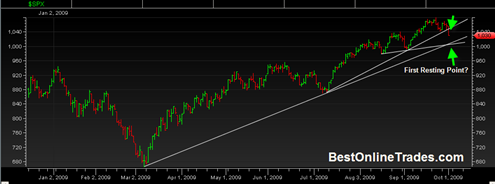
 The SPY slammed down through first trendline support today on substantial volume and once again confirmed the bear case that I have been talking about this week. It was really bearish action today and the dip buying that used to work so well in recent months clearly failed this time.
Right now I am thinking that we will probably come to a ‘resting point’ at 1010 on the SP500 as soon as tomorrow, or maybe by Monday. That level should hold for some kind of reactive rally to the upside. This is what happened on the previous touch of support about 4 trading days ago. It led to a very low volume bounce that led to the severe decline we are in now. So my thinking is that I will close out the TZA position at roughly 1010 on the SP500 and then wait for a multi day bounce and get prepared to go long the TZA again and find other ways to short the market at that time.
I am also thinking that I would like to hold a core position of TZA throughout this entire decline because I think we have plenty of room on the downside.
I have already said many times that it is still somewhat of a mystery to me what the speed of this decline will be. When I first started reading BAMInvestors posts on twitter it opened up my mind to the possibility that this could be a very fast and sharp decline. I hate to use the word crash, but it might resemble that type of pattern at least on the weekly price charts. Up until this point I have been assuming that this decline will be orderly and somewhat slow as it was during the 1975 period after that similar huge automatic rally that occurred.
But then I started thinking about market psychology, the nature of rising and falling wedges and I have come around a little bit to the camp that at least considers a rapid down price move as at least a decent possibility.
From a psychological perspective think about the average investor or even the pro investor who has been in the market for the last few years. They have had to endure a huge severe bear market decline in 2008 that was fast, vicious and relentless in its price decline. If you look at the 2008 bear market on the monthly or quarterly charts it clearly looks like a crash. If we start to get rapid price decline peoples memory may trigger and cause them to be a bit faster on the sell button this time as compared to last.
But still, I think 1010 is a possible resting point for this market as soon as tomorrow and then a reversal for several days, maybe a week in the form of a low volume bounce. The leg down after that should be able to break the long term uptrendline in force since the March time period.
By the way there is a full moon this Sunday, so a bounce occurring either tomorrow or Monday at 1010 on the Sp500 seems quite probable. The closing arms ( indicator which points out extreme oversold and overbought levels) today hit 3.6 which adds to the idea we are ready for a bounce in the next couple of days.
Today’s action in the SP500 has decisively turned the weekly MACD signal line down and closer to a convergence point. So the longer term bearish picture remains intact and I suspect we are looking at LEAST 1 to 2 full months of downside price action here.
If we do pull back to near 1010 tomorrow on the SP500 it would possibly set us up for a somewhat small head and shoulders topping pattern with the head portion completed either tomorrow or Monday.
Automatic Rallies
Ever since the BAMInvestors talk about a crash I have become interested in the automatic rally concept. If the rally from the March lows of this year actually is a true automatic rally then it does not bode well for the follow price action after this automatic rally is over which appears to be the case in the next week or two.
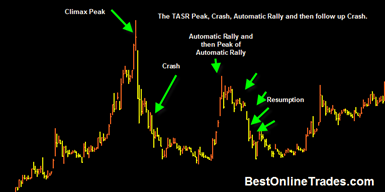
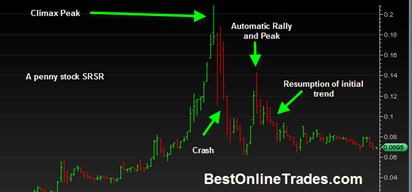
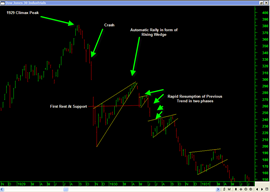
I have seen a few automatic rallies in the past. Some of them have been in individual stocks and the most famous one was during the 1929 crash period. Here are a few charts that depict what I believe to be automatic rallies and the end result of them (click on chart for full size):
After you have an extensive price advance that peaks in a significant climax, price moves into a fast price decline move that marks the bear market leg or ‘crash’ if you will. But price gets so extended to the downside that just the simple forces of physics cause an ‘automatic rally’ to occur. This automatic rally is an expression of the extreme bullishness that marked the price climax and the automatic rally can be EXTREMELY persistent.
I think we can say that the rally that has occurred since the March lows has been extremely persistent. I believe there have only been two other times in market history since the late 1800’s where there existed 7 straight monthly up closings.
And I should add that this automatic rally in the SP500 has been on lighter and lighter volume right into the top of the rising wedge which is not a good sign. You had a very severe price decline into the March 2009 lows that was on huge huge volume, then this automatic rally on lighter and lighter volume…
The volume that comes in on the down leg in the months ahead is going to be the clue as to whether this is going to be a really severe decline that gets enough momentum to smash us to the March lows. Or whether it will be a decline that eventually finds support in the 900 to 950 area before eventually resuming higher in a longer term bull run.
By the way I should mention that even if we do get a downward reaction in the current market similar to what happened in 1929, it should be noted that it will probably take plenty of time to unfold. We are talking many weeks here. I doubt very much that we are looking at a 1 to 3 week severe plunge.
Stay tuned! The month of October is going to be a potentially wild month in the market!


