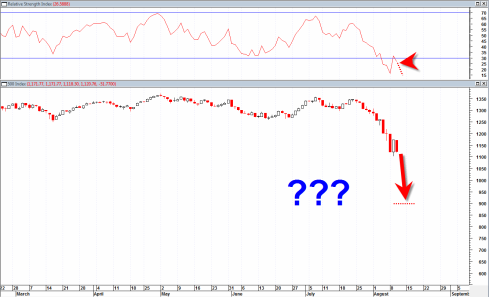
This market is too tough to call right now. The bounce did not work and the VXX break down did not work. I have to describe today as bearish but cannot conclude that the market will blast higher or lower from here. But the bias seems to be more weakness.
If we truly are in extreme bearish mode then this market will take advantage of the one day bounce we had yesterday and push RSI all the way back down to the lows again perhaps in crash form. This is what happened in May 1940. RSI had a slight bounce and then the market got crushed for another equal leg down.
There really should have been follow through today from yesterday’s bounce, but there wasn’t. So now we appear to be in the grey zone where anything goes.
I think most traders and technicians would agree with me that we have not really truly seen a capitulation day. It sort of seemed like we did a few days ago, but then when you look at stocks like AAPL it looks like those shareholders have not really thrown in the towel.
It could be that we are headed for some type of MASSIVE low right on August 19th, 2011.
So I suggest you pick a number ![]() , that number will likely be our low point…
, that number will likely be our low point…
P.S. The BOT Short signal which I issued way back in Late July 2011 is still active.
This is what I wrote on July 26, 2011:
After reviewing several charts on many different time frames I am coming now to the strong conclusion that we have likely hit a major major top in the market in the current time frame and revert back to a previous post where I indicated that we are likely to see massive downside price action into the October 2011 time frame.


OK here are my picks for intermediate correction low next 90 days.
S&P 975 plus or minus 50
DOW 10,500 plus or minus 100
Technically speaking, as long as we don’t take out the low from Tuesday, the bottoming tail is still in tact. If we take out that low on a closing basis, then we’ll probably go to July lows of last year of around 1020-1040 level on SP500. But next week is options ex. Considering the bearishness around, there’s a lot of put options in this market, and it would be the ideal time for the big boys to take the markets higher. Tuesdays low was a 75% fib retrace from July 2010 lows to may 2011 highs and I still think that level will hold. If the market has another leg of downside left, then it has to consolidate and create a bear flag of some sort before plunging lower again.
JR,
S&P at 975 and Dow at 10,500? That’s 13% downside on the S&P vs 2% for the Dow. Hard to believe, really.
IMO Dow 10500, give or take 50, is the target for this week alone, not for the next three months.
I found an interesting pattern to the SPX. The recent downslopes of the trends that take the SPX below its 200-week moving average are all similar in size and slope. If this holds true, we should see the SPX move below the 1050 support the week of 9/19. At the current rate of decline, this seems too long, but on the daily scale, it appears we have found some short term support at 1120, so we could move sideways for a little while while the turmoil in Europe struggles over uncertainty. Keep in mind also that 1101 is the 38% retracement level from the 2009 low to the 2011 high.
There is confirmation of this decline in the COMP It appears to be in the process of forming a longer term head-and-shoulders top, similar to its behavior from 9/2004 to 9/2007, where it formed a mini-HS top in the head of the larger HS formation. If we see do see similar action this time, I would expect to see the COMP cross 2300 mid-September.
The Dow is harder to read, but I don’t see it hitting the 9686 support level until early October. This would imply a 4-week lag but that isn’t unprecedented. The Dow frequently sees smaller percentage declines than the SPX and COMP.