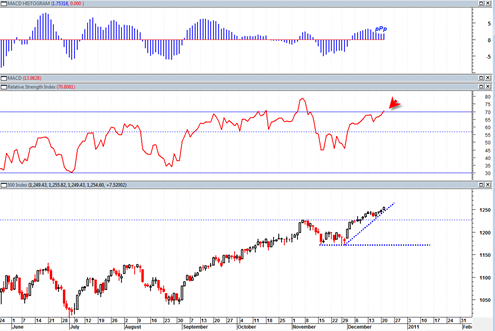
The sp500 today continues to trickle higher on some of the lightest volume levels of the entire year. The MACD histogram is showing a bullish triple P setup which would be confirmed with a close above today’s price high.
The RSI is close the 70 level and could mean a move above it into the power zone. This could be a bullish sign as we move into end of week and set up some follow through next week into the end of the year. But after that it would make sense for some type of first week of January 2011 pull back to start some type of retracement into the 2010 yearly candlestick.
The market has been surprisingly resilient and somewhat deceptive as well. I would have to characterize the tape as strong, but the low volume nature of the advance makes one question the longer term underpinnings of the rally.
BestOnlineTrades will probably attempt a short signal on January 3, 2011 if the indicators come into agreement with a possible pullback at that time.
In my opinion it would be very unlikely that the market will just continue relentlessly higher right from the first week of January 2011 and the follow weeks as well. There should be some type of retracement into the 2010 completed candlestick before any type of new 2011 rally takes hold.


Tom,
That sounds like a good plan!
There is some long term Pi symmetry in early Jan from the 10/11/07 1576 high. I’m just not sure how it is calculated. 🙂
Thanks!
Market may be at a significant top. Seems unlikely, but here is why:
(1) This site and http://pugsma.wordpress.com/ site have both over the past 6 to 8 wks noted intermediate term divergences over period of 6+ months. I think I recall that this site was noting the divergence of on volume balance (or something like that) trending down while price trending up. The pug site has noted similar and multiple divergences spanning months.
(2) The Aall Investor Sentiment Survey as of 12-22-10 had a very lopsided weekly result. The survey result was almost as lopsided as at the March 2009 bottom. The important caveat is that this reading is during yearend, but i weigh that with (1) above to think that important intermediate top may be in. The pug site is only calling for a market correction into February of back to SP 1145 more or less. Anyway, the latest reading of Aall this morning was 63.3% Bullish with amazingly only 16.4% Bearish. This really is an outlier reading. At the March 2009 bottom, the weekly Aall reading was almost equally skewed but to the bearish side with, as i recall 19% bullish and 70% bearish. If this latest reading occurred during a normal time frame, I would be “all-in” in the contrary direction.
For reasons (1) and (2) above and because, I fundamentally do not think USA has solved much of anything over the past 2 years, I think this could lead to market correction. This is definitely contrary to my holiday mood, and the good vibes coming out of Washington. So maybe it is time to go against the grain.
For those mite be interested, access http://pugsma.wordpress.com/ and toggle back to his public commentary of Dec 14th EOD – – he mentions and shows 3 divergences.
I tried to find where this site had an extremely compelling graph on OBV going back many months. Sorry, I could not find, but if I recall correctly it was incredibly compelling. This graph was about 6 wks or more ago.
I am noticing some bearish divergences as well on the daily sp500 chart over the last two weeks although I have not written about them yet. Also as of 12/23/2010 there a bearish triple M in the MACD histogram which so far is unconfirmed. A close below the 12/23 low this up coming Monday would confirm it.
There is complacency everywhere and yet the market keeps going up. Also 10 Day moving average of put/call looks like approaching the April 2010 level http://stockcharts.com/h-sc/ui?s=$CPCE&p=D&yr=2&mn=0&dy=0&id=p73333187613
I was thinking ‘the correction’ may start the first week of January, but maybe it could start building a foundation next week. Either way, volume is likely to be very light next week without much commitment.
Tom
Can you update the graph / comment on OBV on SPY that u featured in your posting of 23rd Nov 2010? That was incredibly compelling graph. What does it look like now and what u think? Thxs