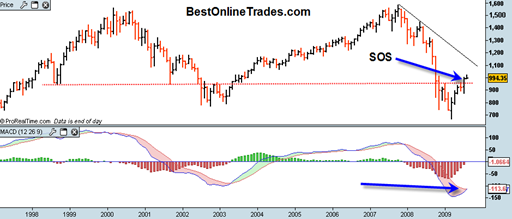
The SP500 is about to get a bullish monthly crossover on the MACD indicator, a popular moving average combination indicator that can become very useful over longer time frames. The monthly MACD signals can signify new major bull or bear market moves with sometimes 1 year or more duration.
The current daily MACD signal is starting to flash some near term sell signals and could set us up for a move to test the 940-945 range on the SP500.
It is confusing sometimes when you have a sell signal on one time frame and a buy signal on a different time frame. To help clear the confusion, I always keep in mind that the longer term time frames have precedence over the shorter ones. So while we could get some selling pressure into 940-945, we must remember that the longer term signal is indicating higher prices.
Incidentally, look at the red dotted line I drew on the chart. This appears to be a significant support area. July’s monthly price bar thrust through this former resistance line with a SOS (sign of strength), a wide range price bar and a close at the top of the bar. Now, so far in August we have had meager follow through to the upside and now appear to be selling off a bit and probably will sell off some more for the second half of August to the 940-945 range as a retest of long term support.
There still seems to be this debate going on whether or not the current rally is a massive bear market rally that will now collapse and send us all the way back down to the March lows and beyond, OR whether we are in a new mini bull market.
My take still is that we are in a massive sustained inflationary bounce similar to what occurred during the mid 1970’s. This bounce could be very massive and even allow us to break through the black down trendline in the chart above and eventually send us to 1300 to 1400 on the sp500. I believe that this scenario will catch most people off guard. If the SP500 accomplishes this feat it still does not mean we will get a run away bull market in my opinion. After the move to 1300 to 1400, then I would expect a very long retracement that just turns sloppy and meandering perhaps for YEARS.
So I am not in the 1929 repeat scenario camp right now.
I may change my opinion at any time but as of the date of this post, that is my stance on the broad market.
If you think about it, what this market has done is the most deviant thing it could ever dream of. In 2007 it briefly touched a new all time high but then swiftly started collapsing into the ‘great bear’ of 2008 with very rapid price destruction that almost looked like a crash going into the end of 2008.
But then a huge rally got going and started moving very fast and now may continue higher for another 6 months to a year possible going all the way back up close to the previous highs! Think about how tricky and deviant that is! It is like a massive pendulum swinging back and forth violently and making it very difficult for people to get a clear read on. It would be the ultimate in volatility.
I believe this will be the norm for quite a while and is characteristic of an inflationary era where we see wild swings as the market struggles to find direction in a MASSIVE trading range.

