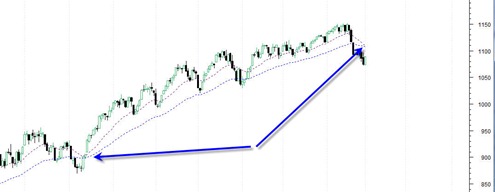
The SP500 20 and 50 day exponential moving averages are inches away from a crossing point. This is noteworthy because this setup also occurred on July 14, 2009 and was the exact low point of that extended correction before a strong resumption of the bull trend.
The two things that are different this time around however are that we have the weekly trend in bearish stance (weekly MACD) and we have downside volumes that are very heavy relatively speaking that seems to be confirmed the weekly trend change.
However, as usual there is always an alternative scenario. The alternative scenario is that the market will find a way to rally strong from here and move to new highs but in a sloppy upward sloping channel type manner. This is what the market did in the 2004 to 2007 period and despite weekly sell signals the market just kept pushing them higher and never really had a major severe extended correction.
Right now I doubt that this scenario will come to fruition. Instead I believe today’s low volume bounce may carry through another day or two and then we should see a resumption of the downtrend and further correction into mid February.

