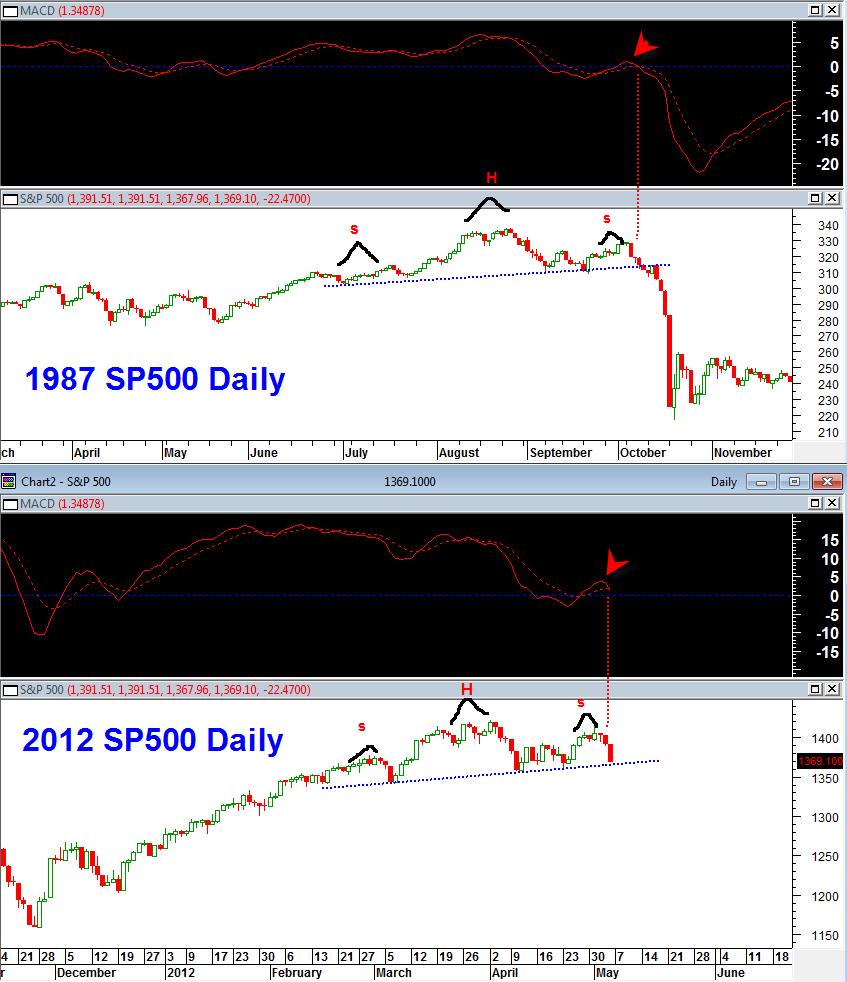
Some traders are pointing out possibilities of a stock market crash this May 2012. On several other occasions in the past on Best Online Trades I have looked closely at scenarios where the market was patterning similar to previous crash formations such as 1987 or 1929. Most of the time these types of predictions fail and are very low probability events. I was able to ‘catch’ the May 2010 flash crash which was an important lesson how this market still wants to throw curve balls at us when we least expect it.
So perhaps now is the time to consider sharp decline in the market given the current state of bullishness and general optimism.
I think from a longer term perspective the market is still trying to decide if it is in a bull market or a bear market (the market indices).
The yearly breakup move that the sp500 recently did had the first appearance that all is well and new bullish trend can continue and extinguish the old bear trend. But the problem with this comforting thought is that the yearly candlestick is nowhere near being complete for 2012 as discussed in my previous post here.
A sharp move down this May 2012 would conceivably be consistent with a market that has moved up into a breakout range, but then encountered heavy supply and then quickly wants to revert back inside the trading range. We will have to see if this is the case in the rest of this month and then as we close the quarter in June 2012.
The chart above shows the sp500 in the 1987 time frame and the 2012 time frame. The daily MACD is in a similar stance where it attempted to cross above the zero line but then moved towards a failure and renewed move back under the zero line.
We are in this state right now. The real question is whether or not the price of the market follows the indicator in rapid fashion.
In my experience analyzing these similarity scenarios, the markets move down needs to occur very rapidly for this comparison to be valid. If the market takes too much time chopping down then it quite quickly starts to make the comparison invalid.
Note also the similar head and shoulder pattern before the MACD similarity.
Will it work this time?
It might. The larger head and shoulder topping pattern on the NYSE showing peaks at the April May time frame is quite compelling. But it is important also to note the very large size of the pattern on the NYSE. This seems to favor the argument of a more slower and choppy phase down instead of an instant type move.

