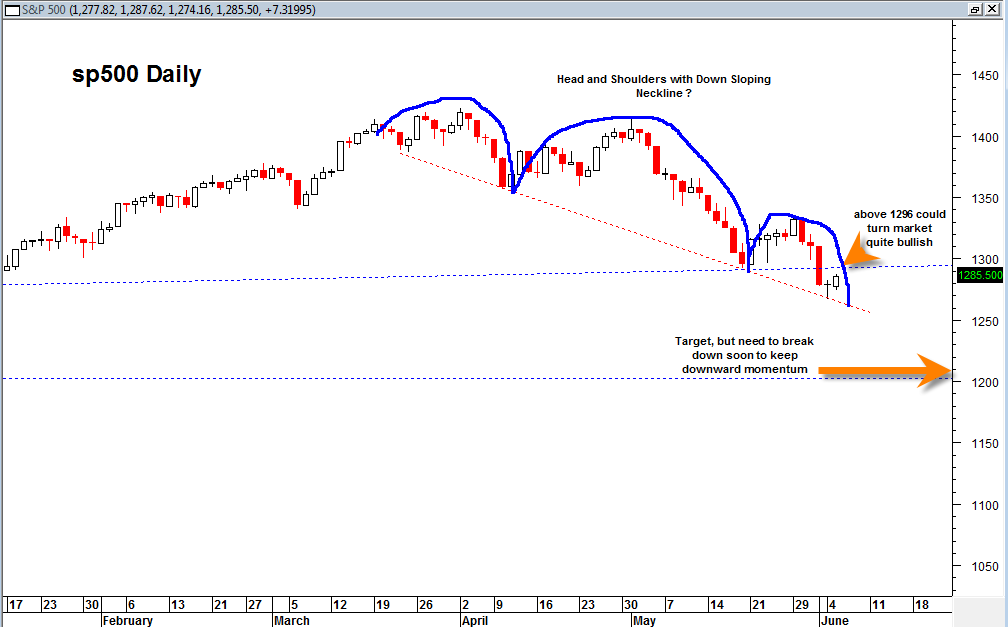
The short term technical analysis of the sp500 suggests that any trading and closing prices at or higher than 1293 will be a problem for the bearish case in the near term.
Today the sp500 engulfed yesterday’s small reversal hammer candlestick and sets up a short term bullish tone. In addition there is a bullish divergence between RSI and price and between MACD histogram and price on the sp500. Also in addition there is the potential for a 2B buy signal that would start to engage at 1293 and higher on the sp500. The farthest extreme I can see the sp500 trading the rest of this week and still have potential to remain bearish is 1296. In other words, 1296 is the last line of defense level that bears needs to hold to keep the near term bear scenario alive.
Closing above today’s high in the sp500 would also confirm a short term MACD Histogram buy signal setup. So tomorrows price closing in the sp500 will be key.
To complicate matters the QQQ is now pretty close to the large supportive range I discussed in a previous posting. It is not deep into the range, but maybe close enough for the market to sense it wants to bounce and try to hold support. So far the QQQ hit a low of 60 and not even into the 58 to 59 range that I thought would be necessary for a valid retest of the previous breakout.
The NYSE summation index continues to be in a bearish stance but looks like it wants to start to curl upwards for a bullish trend change. It has not happened yet however and price action that closes this week will go a long ways towards confirming or rebuking the near term bearish case.
The same situation applies to the percent of stocks trading above the 50 day moving average.

The chart above shows the sp500 in a head and shoulders pattern with a down sloping neckline. But again, breaking above 1296 could destroy the near term bearish implications of this pattern rather quickly.
I we start to see heavy selling again the rest of this week then the 1200 plus target comes into play again.
