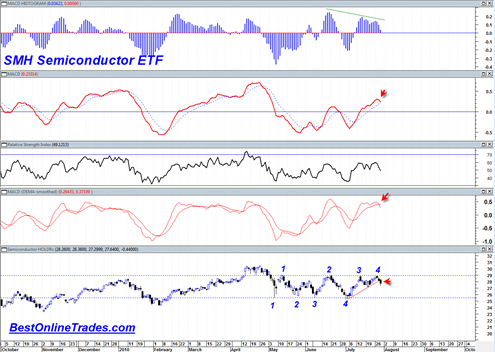
The Semiconductor HOLDRs ETF or the SMH today broke down with heavy volume through the short term uptrend that has been defined since July 1st, 2010. It looks like a valid break of this short term up trendline and it was done so with volume conviction. Some may say that the Semiconductor HOLDRs are a leading indicator inclined to give signals earlier than the rest of the market.
But despite this short term trendline break the overwhelming fact about the SMH chart below is that it has a very clearly defined 3 month price trading range. The trading range is more clearly defined in the Semiconductor HOLDRs than most other indices.
So at this point there are 2 issues:
- The near term direction
- The breakout direction
The near term direction looks like it should be down from here given today’s short term uptrendline break down with volume. There are other signals including a possible daily MACD downside crossover and a confirmed MACD histogram confirmed sell signal yesterday.
The second issue is what the eventual breakout direction will be out of this large trading range? I really do not have the answer to that question. All I can say at this point is that every time the price of the SMH gets near either the top of its range (29) or the low of its range (25.5), there is a risk that it will be overtaken.
Up until today each range level has been visited 4 separate times. If we do start to travel back down to the bottom of the range the odds are going to be that we hold support at 25.5 for the simple reason that this level has held up 4 times previously.
One clue that may help determine if the level will be broken or not is how we come into the support level. The presence or large candlestick bottoming tails near the support area as well as a hesitant price is the first clue that support will hold again.
If a break is going to happen you want to see it happen quite rapidly and preferably with a large strong candlestick. Generally speaking I would want to see a break occur within 2 to 3 trading days at most when it is near the supporting range.
Despite my recent bearish tendencies, looking at this chart still shows us that we are contained within a large supporting range. We are still trading near enough the top of the range that a topside breakout cannot be ruled out. But near term downside momentum and the short term uptrendline break with volume suggest we should head back down towards the bottom of the range again (in addition to the oscillator sell signals).

