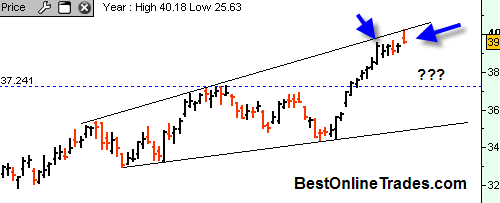
Remember I did this post on the SP500? I was talking about how we are somewhat constrained by this top line resistance that has some tendency to a broadening wedge formation. Then I did a post a couple days ago on the QQQQ and said that the QQQQ’s seem to be signaling a top based on a test of previous swing with 26% lighter volume.
But Today the Market was up like the 4th of July!
Yes it was. I thought for sure I would have egg all over my face after saying that the QQQQ’s had signaled a short term top based on the price retest on 26% less volume and a price close under that relevant price swing.
But then the market sold off today during the last few minutes of trading. The price candlestick looks like a bearish shooting star, and there is a gap to fill too. And again, we are at the top of the range of resistance… and we are at the last day of the month… and we are going into super slow summer doldrums month of August…
So that Evidence Tells me we go Down Now
For the short term anyway. And that blue dotted support line I drew on the chart looks like a perfect place for price to settle down in, right near the breakout area. But the bottom line of that wedge is also fair game eventually, but that is looking a bit too far out for now.
By the way the volume today on the QQQQ’s was light again compared to the 1 week ago swing. So it is just more evidence for the short term that we are headed down.
What if I am wrong? If I am wrong then I see two possibilities. I see the market clinging to that top resistance line for another week or so, OR I see it jumping right over that resistance line. I see these two possibilities as unlikely right now.
So that is my take! Let’s see if we get any follow through to the downside tomorrow (the last day of the month of JULY! so we will get a completed monthly price bar) on the QQQQ’s and the other indices.
| Short Term | Long Term | |
| SP500 | ||
| Legend: yellow=neutral green=bullish red=bearish |
