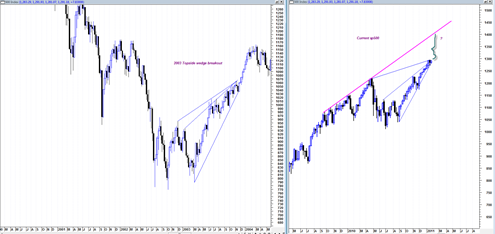
I really hate to do it, but the market is unwilling to pull back for now, and I need to switch to a BOT long signal tomorrow. As Jesse Livermoore said, “a stock is never too high to buy and never too low to short”. I have been on the neutral signal for some time now because I wanted to see how the market would react to resistance at 1300. So far it has been a non event. Please refer to my previous post on the sp500 possibly transferring to the ‘parabolic’. I believe this was a key insight and helps to create an understanding of the type of trading dynamic we are in right now.
I realize there has been a lot of talk about the supposed rising wedge on the sp500. The problem with wedges are twofold. First there is a tendency to try to identify them repeatedly on market indices when they do not really exist. Secondly, these supposed wedges have a bad habit of turning into running corrections and then breaking out in sometimes near vertical fashion through the apex of the wedge. That type of behavior is also consistent with parabolic trading markets.
Attempting to identify tops from rising wedge formations that continue to persist higher is extremely cumbersome. It is better to wait for better longer term reversal signals such as the quarterly sp500 chart plotted against quarterly RSI. I believe that this will be a superb turning point signal. More on that in a future post.
One could argue that we have already completed a parabolic portion given the apparent near vertical nature of the current weekly chart above. However the top red channel line appears to be an ideal strong magnet for the market to trade into eventually. The sp500 is still holding up trend line support and until that breaks I don’t see how the case can be made for a major market break down.
The chart above shows the possible rising wedge in the 2003 time frame and the eventual topside breakout from this false rising wedge.
It could still be that a lot of supply will come into the market assuming the sp500 can get into the 1300 zone. We will just have to wait and see what transpires assuming a surge up into that zone later this week.


Thanks for the update.
IMO, S&P will react from around 1309 to 1260ish.
Rise back to 1358, IMO.
You can see my ability to look into future and get in to mess (LOLz)…
Cheers,
S
Slow trending markets can be tough to read …especially when they go up in a straight line.. seems too odd.. But you were right in looking for 1280 sp500
Question: How many failed attempts to go through resistance does it take before the market rolls over?
To wit: the Dow industrials, still not over 13000 or the S&P 500 still not over 1300.
Dow 12000. I count four tries in last four days. For the S&P 500 it has made an attempt at 1300 every week this month! With a failed attempt today at 1299.54!
Every attempt represents dissipated energy. Even a bullet shot straight up runs out of momentum.
In this case it looks like it will take about 2 attempts, possibly three. I see very hard down monday of next week, then another weak reaction upwards and and then big down after that.