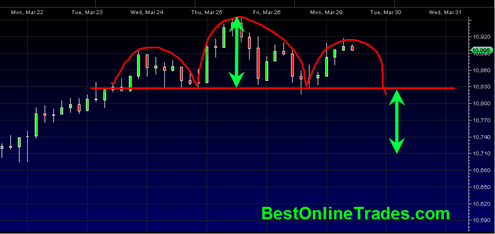
Don’t give this chart too much credit because it is only a 60 minute candlestick chart of the Dow Jones Industrial Average and may invalidate in just an hour or two.
But I could not help but notice at least a possible head and shoulders topping pattern on the Dow Jones Industrial Average. If the pattern works out then we should see a break of the neckline in the next day or two and then a target of the 10,700 range.
For this to keep working, we really ought not to see the DJIA go higher than 10,916.49 from the date and time of this post until the end of trading today.
Could it be that this simple intra-day pattern is marking a very significant top in the markets that will result in a follow through similar to the 2007 time frame ?
We won’t know the answer to that question until much later this week probably, but it is awfully tempting to believe that this little head and shoulder pattern will work and confirm my 2007 – 2010 stock market price structure similarity…
It is 12:38 PM right now, so several more hours to go until end of day. Right now the DJIA is trading at 10,891.70, and there are about 3 more hourly candlestick bars that need to show up in the chart above…
So lets see how it looks at 4PM…

