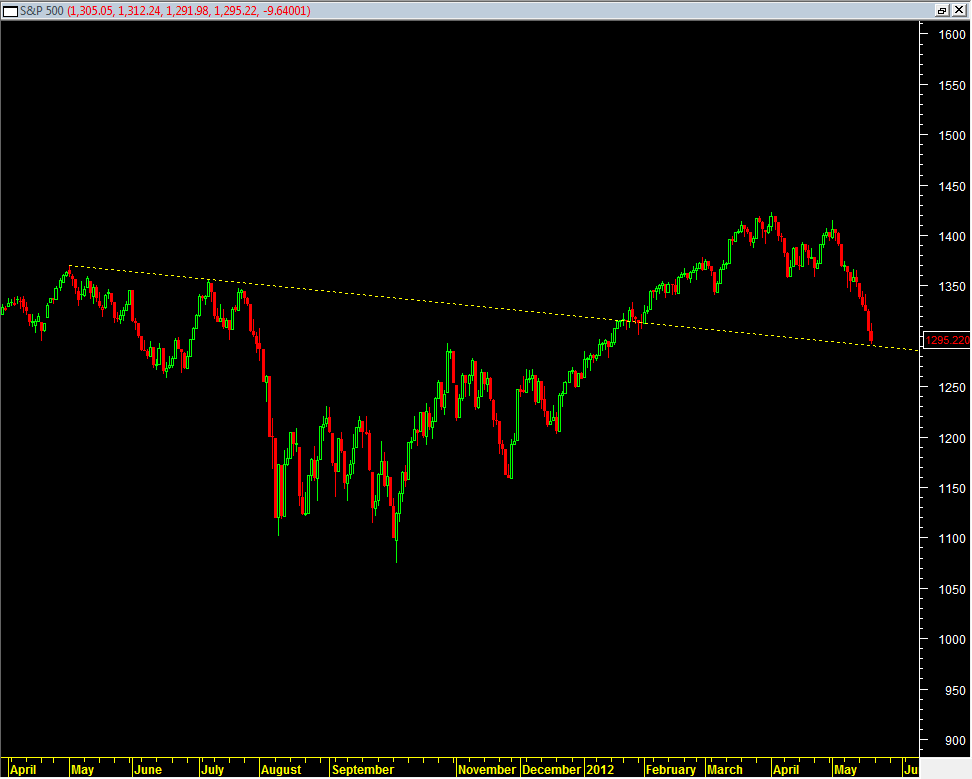
I wrote before that it looked likely the market would go down into May 21, 2012. So far we have in somewhat slow orderly fashion despite the fact it has been an almost record string of straight down days.
The issue going into a low is whether the low is a washout sell off day which we have so far not seemed to have had, or if it is the final bottom on which the market just gaps up and runs higher. This weekend was the solar eclipse and also a new moon and so there is a strong cycle argument for the market making a low here. I thought the market would at least get some type of washout down before finishing this low but it may be that we do not get that. We may have hit bottom for now and the market may start to work off some of the oversold condition which clearly exists. The sp500 futures are indicating the market will open higher tomorrow, but it is still much too early before Monday AM for a clear signal on that.
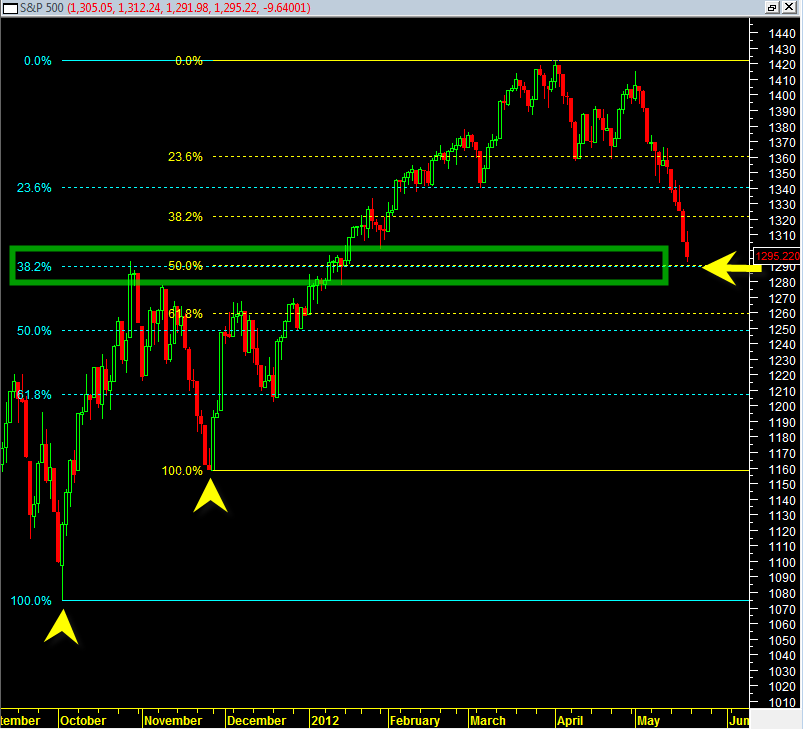
There is also an important observation regarding Fibonacci retracement levels.
Right now we are at the 38.2% and 50% retracement levels from the October 2011 and November 2011 lows respectively.
So we have two Fibonacci support zones showing up right at the current sp500 price level. If the market is able to hold the current level as an important low then one has to be open minded that the market may have staying power from current levels.
The second chart above shows the sp500 hitting a declining trend line support zone in combination with it zoning in on the two Fibonacci support zones.
The above two charts could suggest we are at short term low. How strong and sustainable the low is (in terms of time) remains to be seen.
If the surprise rally does manifest itself then one has to observe 1340 level as important resistance that would ideally fail for the bearish case.


