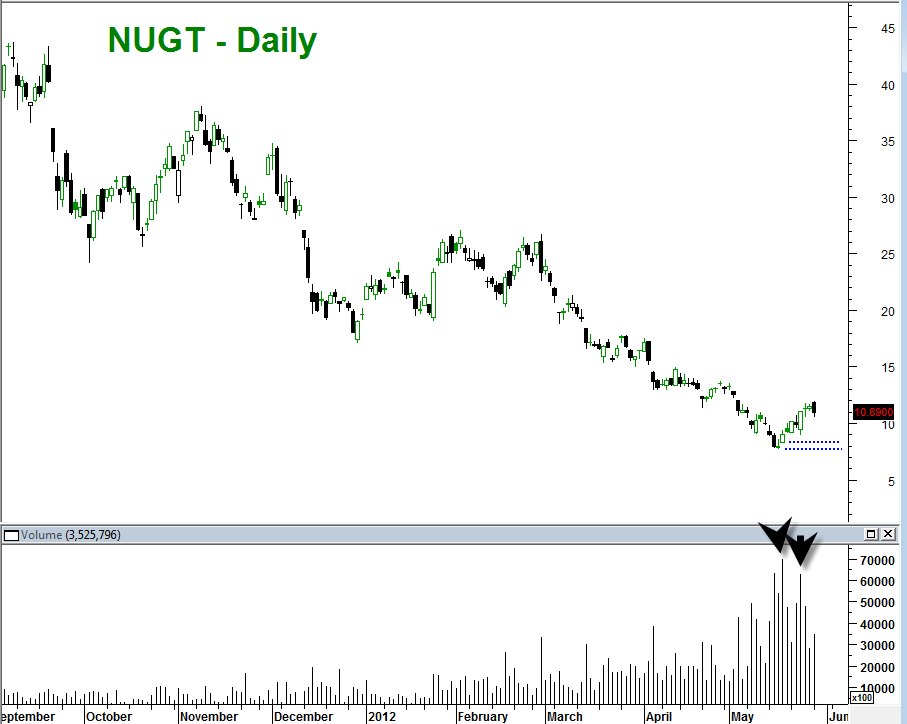
The NUGT ETF is a wild leveraged ETF that can present some outstanding trading opportunities for the careful and precise trader. Careful is the word to emphasize here as this is a triple long ETF. Swings of 10 to 50 percent are not that uncommon at all.

It is also a good ETF to keep an eye on because it is also heavily correlated to what major mining indices such as the XAU and HUI. The gold price also plays a role obviously since these are for the most part gold mining companies we are talking about.
The gold price, the XAU and HUI are clean indices that tend to reveal clear and clean Fibonacci patterns.
There are a few things in play right now. The gold price is in a potential buy and bounce zone. The Euro is also in a strong potential buy and bounce zone. The XAU is showing as of 6 or 7 trading days ago the completion of an important bullish pattern with bullish implications. In addition, tomorrow Wednesday May 31st, 2012 is the last trading day of the month of May which means that final monthly candlesticks will be printed.
If the mining indices get another carry on rally tomorrow it will create a really clean looking MONTHLY hammer candlestick reversal indication.
So there are still some conditionals that need to happen for the NUGT to perform well. But honestly I think the conditionals will favor the NUGT continuing to power higher.
Unfortunately this post is a bit late from the ideal entry which was near pattern completion about 6 or 7 days ago ( trading days). However, I feel that this is a significant potential low in the XAU and NUGT. This will be especially true if the USA indices continue higher and the gold price gets its footing and establishes a firm low here as well. In the environment of bullish USA indices and renewed rising gold price it would be a superb condition for NUGT to power higher.
There is often a dance between mining stocks and gold price. It has been the case many times in the past where the gold stocks lead the gold price. Clearly, gold stocks have been slaughtered into the recent current juncture. But heavy selling brings opportunity and my sense right now is we may be at a similar buy point in mining indices as was the case at the 2009 low. Such an observation may be a stretch however since we are still so early off the bottom at the current juncture. The lowest risk buy in the NUGT was in the low 8 range. NUGT may still retrace back down for a higher low double bottom in early June. On the other hand if the gold price manages to pop higher tomorrow and early June and the stock market as well gain more upside momentum, then the NUGT may only do minor retracements and continue the current run into the 15 range.
Honestly I wish I was paying more close attention to NUGT and XAU patterns on 5/16/2012. In addition to the important fibo completion pattern on that date on the XAU we also saw an inverse hammer candlestick which was a good bottom signal. It would have meant only a few pennies of risk to the downside with enormous upside risk reward.
Now the setup is a bit trickier. Ideally NUGT and XAU will do a fibo retracement and then an AB-CD up projection from there.
