November is shaping up to be quite a key month for the sp500 index. We are moving into a juncture of determination on whether we continue to drift/correct in downward bear market fashion, or bust out north in new bullish fashion.
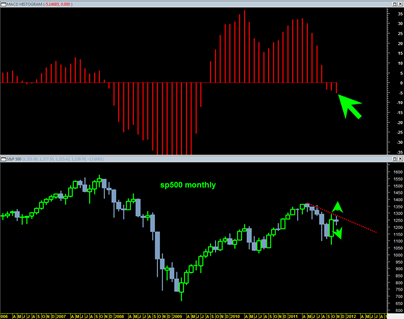
The monthly MACD has been in a bearish crossover mode for several months. This is a longer term bear market signal and has given the bears a lot of encouragement.
October 2011 was an extraordinary powerful northward closing monthly candlestick. The October 2011 monthly candlestick probably should not have occurred if we are truly in a longer term new mini bear market.
But it did. And now the current November 2011 monthly candlestick is showing form as a monthly indecision DOJI candlestick. We are now almost into the midpoint of the month of November 2011. So the current November monthly Doji candlestick could continue to stay form as a doji and see price just drift sideways into end of month, or it could start to transform into more bearish looking candlestick again (essentially this would mean lower prices into end of month November 2011).
The odds that this market finishes the second half of November 2011 hard down into Thanksgiving week seem not highly probable.
November is a key monthly candlestick because it has the opportunity to still expand to the upside (perhaps into end of month November 2011?) which would in effect move the monthly histogram bar higher and potentially create a bullish triple P setup in the monthly histogram bars. This would only occur if we see a quite strong finish to November 2011 that markedly exceeds the current 2 week range bound nature of the market.
So if we do get that strong end of month move it would set up the bullish triple P pattern in the monthly MACD histogram. Then, we would need to see a monthly closing price higher than the November 2011 high for the bullish triple P to turn into a confirmed bullish triple P monthly histogram buy signal which would invalidate the longer term monthly MACD bear signal.
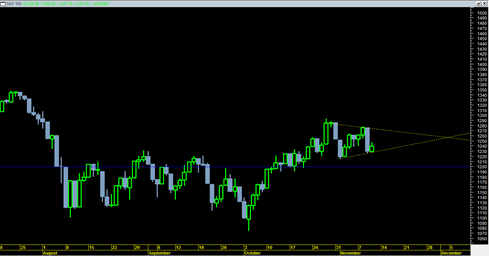
1200 looks like must hold support to me.
The price action on 11/09/2011 was an important sign of weakness.
But so far the sp500 is still trading in a triangle congestion range and the breakout direction still needs to be determined.
Look for the sp500 to maintain low price points over the next few trading days that maintain at 1230 or higher to keep the triangle structure intact.
If we see a swift drop below 1230, then something else may be going on here (ie. a chance for more weakness and then challenge of 1200 level.
But for now the outcome of this triangle is unknown. But it has important implications with respect to the monthly chart previous discussed.
We are moving into a longer term decision point.


