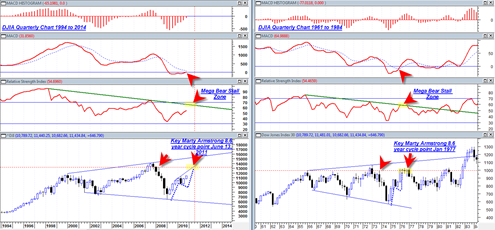
I have been reviewing the long term quarterly charts of the Dow Jones Industrial Average in the current decade and the decade of the 1970’s. The 1970 period has provided me with some enormous cutting edge clues as to our current long term outlook. The structures are not exactly the same and one should never assume that a perfect repeat will occur, but they do offer clues which can be confirmed with longer term oscillators and other indicators.
During the April 2010 to September 2010 correction there was still some doubt about whether or not we would see a continued decline that spirals the market into a further deflationary spiral or whether we would be able to blast higher in a new inflationary leg up similar to the 1975 time period. For now it looks to me like the market has chosen the 1975 inflationary scenario.
The question now becomes what type of new advance is the market capable of? In 1975 the DJIA was able to show an initial very strong follow on surge of an advance back up to the 1000 level. It was a very strong move and at the time probably made it seem like the market was destined towards new life time highs. But amazingly, not too long after that surge the DJIA stopped dead in its tracks and then started trading sideways for an almost 1 year time frame.
Also interesting about the follow on surge in 1975 is that it also occurred at a time when the quarterly MACD fell slightly under the zero line and then was able to get a northward bullish crossover. The advance was stopped when quarterly RSI hit the long term bear market resistance line.
We now find ourselves in a very similar situation on the quarterly DJIA chart. The quarterly MACD is about to initiate a bullish cross and the quarterly RSI is rapidly approaching the long term bear market down slope of RSI (noted by the solid green line). It is important to note that the quarterly MACD bullish cross does does not necessarily have to imply a major super long term bull market. It could simply be an initial cross and then soon after bearish cross again later as the market wakes up to economic realities. This was the case in 1975 to 1976.
Also very interesting is that the 1975 advance was finally HALTED and turned into a complete MAJOR reversal right on the major 8.6 year 1977.05 Princeton Economics Marty Armstrong Cycle point. Then the DJIA went into a 1 year 20 percent decline.
It is very interesting that the current advance seems to have similar dynamics and that we also find ourselves close to the next major Marty Armstrong 8.6 year cycle turning point which falls on June 13, 2011. I can see the market moving up right into the June 14, 2011 cycle turning point and then stalling near the June 30, 2008 quarterly swing high near 13,100 in the DJIA. Quarterly RSI should provide major resistance for the market next year.
If the scenario is to play out quite similar to the 70’s decade then we should see a continued surge into the end of this year, then a much slower choppy advance as 2011 starts and then transfer into essentially a completely flat and sideways market (perhaps as inflation starts to tick higher substantially etc. ) until we reach the point of the June 14, 2011 major cycle turning point.
I am going to be SHOCKED if the market over the next 1 year time frame plays out exactly as I have written here. Long term forecasts are difficult enough, but for the market to continue to play out with such a high correlation to the 70’s decade would be simply astonishing to me.
The major clue that I will be looking for as we approach the June 14, 2011 is a topping of RSI and MACD on the monthly time frames. The monthly MACD is going to signal the next major protracted bear market decline phase for the indices. If we start to see the monthly MACD curl over near the June 14, 2011 time frame then one has to consider the possibility that a repeat scenario is occurring.
For now it appears we will continue the bullish advance phase which could be a massive surge into the end of this year that is unprecedented. But the irony is that it would then transfer into a completely sloppy much more cumbersome advance that transfers into a sideways extended duration distribution phase.
If it plays out similar to what I am describing here then flexibility is key as far as expectations of the market. If the market moves into a sideways sloppy 1 year trading range next year, one has to be open to a micro trading or much more shorter term trading style. It would also suggest an environment where high growth stock selection (tech sector ? ) is paramount and also focusing on businesses that have very strong brand pricing power (if inflation starts to become a serious issue next year).

